
Figure 4. SEMA6A and SEMA6B mediate binding and entry into cell lines and primary human endothelial cells.
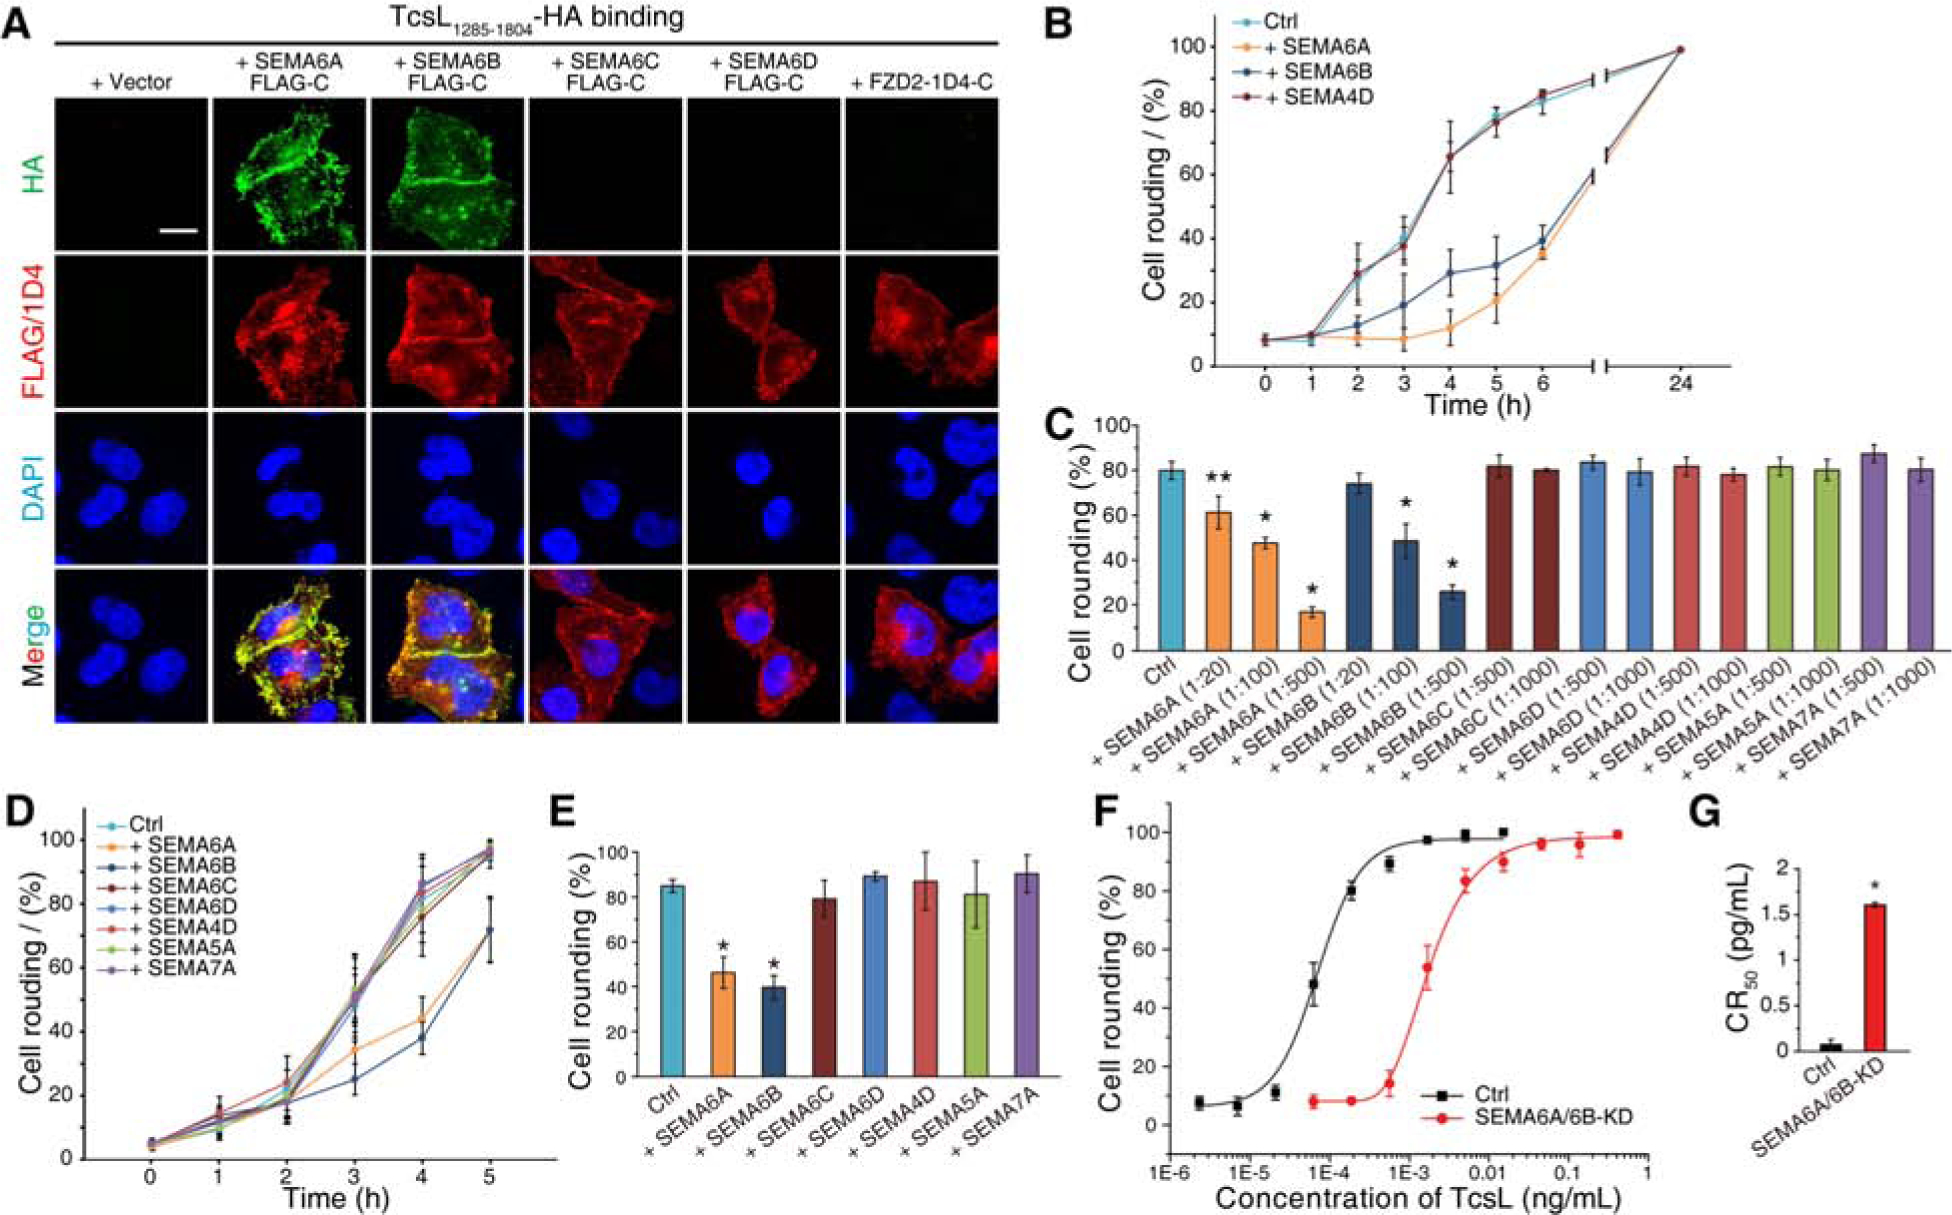
(A) HeLa cells transiently transfected with SEMA6A, 6B, 6C, 6D, or FZD2 were exposed to HA-tagged TcsL1285–1804 (7.5 μg/mL) on ice for 60 min, washed, fixed, permeabilized and subjected to immunostaining analysis. Expression of exogenous SEMA proteins was confirmed by detecting fused FLAG tags. FZD2 was detected by fused 1D4 tag. Nuclei were labeled with DAPI. Scale bar, 5 μm. Representative images were from one of three independent experiments.
(B) A549 cells were exposed to either TcsL (40 pM) alone or TcsL pre-incubated with ECDs of SEMA6A, 6B, or 4D at 1:500 molar ratio on ice for 1 h. The percentages of cell rounding were recorded over time.
(C) Experiments were carried out as described in panel B, except that TcsL was pre-incubated with the indicated proteins at the indicated molar ratios. The degrees of cell-rounding with 5 h incubation were plotted as a bar-chart. Error bars indicate mean ± s.d., N = 3, *, p < 0.01, **, p < 0.05 (one-way ANOVA).
(D-E) HUVECs were exposed to either TcsL (4 pM) alone or TcsL pre-incubated with ECDs of SEMA6A, 6B, 4D, 5A, or 7A at 1:1000 molar ratio on ice for 1 h. The percentages of cell rounding were plotted over time (D). The degrees of cell-rounding with 4 h incubation were plotted in a bar-chart (E). Error bars indicate mean ± s.d., N = 3, *, p < 0.01 (one-way ANOVA).
(F-G) The sensitivity of HUVECs transfected with siRNAs targeting SEMA6A and SEMA6B to TcsL was analyzed using the 24 h cell-rounding assay. HUVECs transfected with scrambled siRNAs served as a control. The dose-response curves are plotted in panel F, and their CR50 are plotted in a bar-chart (panel G). Error bars indicate mean ± s.d., N = 3, *, p < 0.01 (one-way ANOVA).