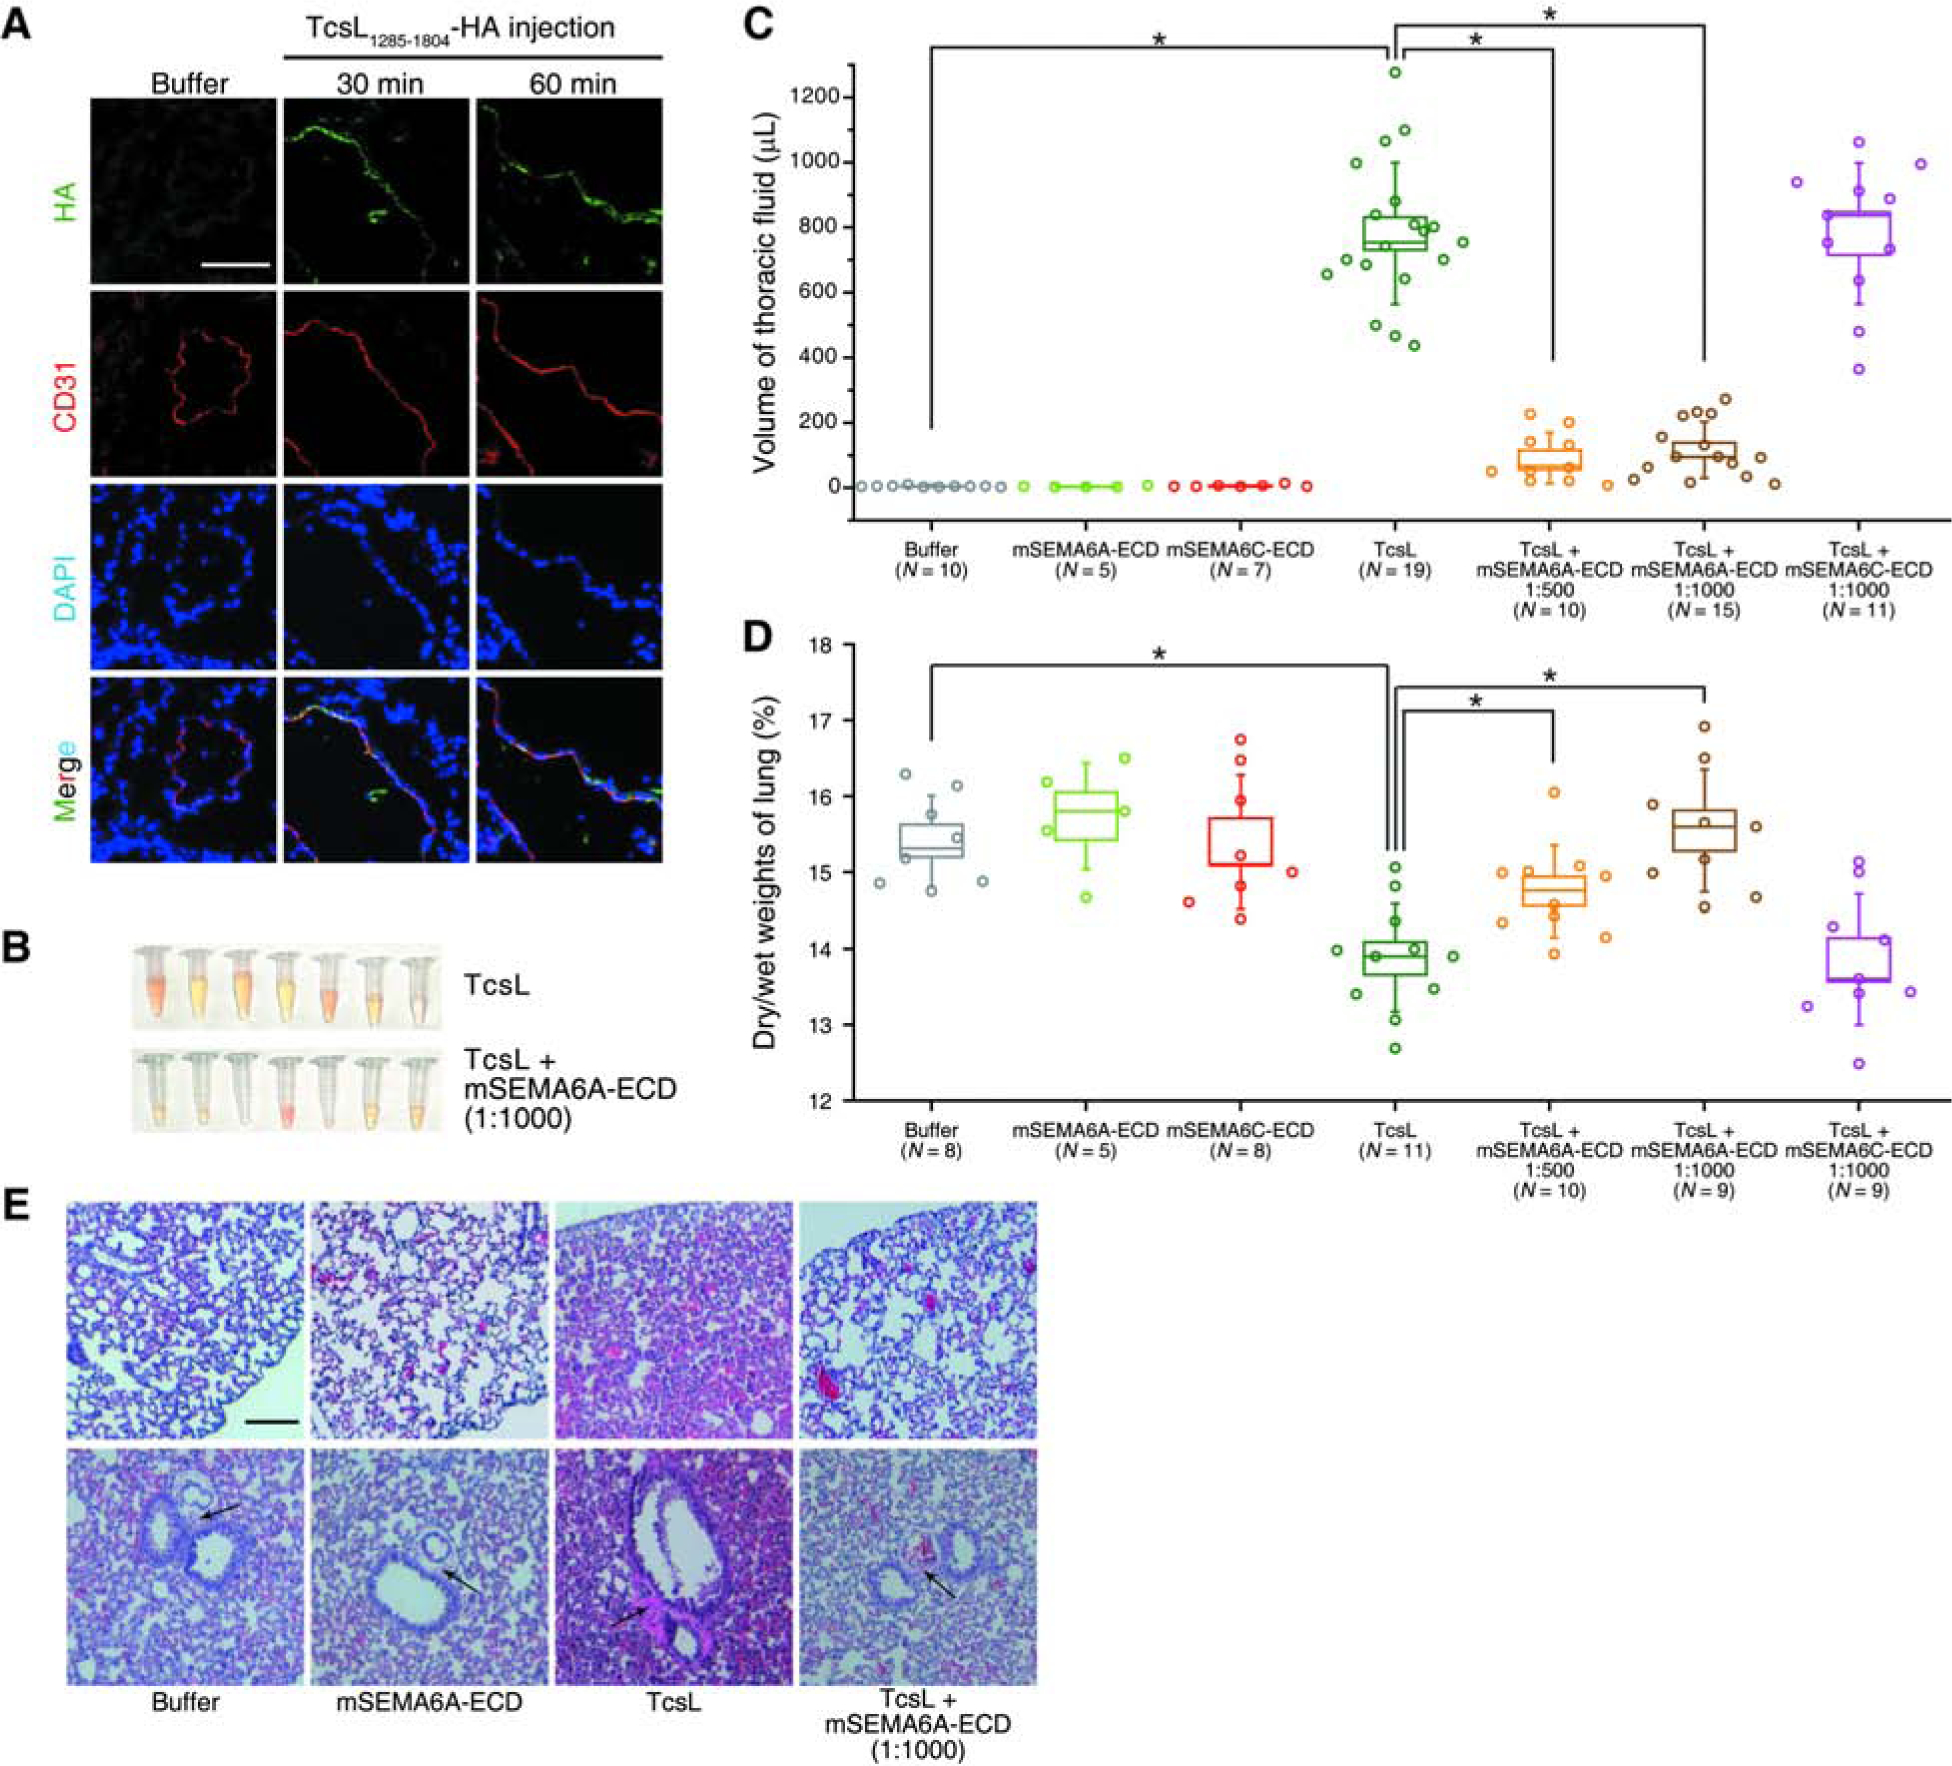
Figure 5. SEMA6A-ECD reduces the toxicity of TcsL on lung tissues in vivo.

(A) Mice were injected with Buffer (HBSS with 0.1% BSA) or HA-tagged TcsL1285–1804 (200 μg per mice) for 30 min or 60 min. The lung tissue was harvested, washed, fixed, and subjected to immunostaining analysis. The TcsL1285–1804 signal was detected via the HA tag. The endothelial cell marker, CD31, was detected to label endothelial cells. Nuclei were labeled with DAPI. Scale bar, 100 μm. TcsL1285–1804 is largely co-localized with CD31. Representative images were from one of six independent experiments.
(B-C) Massive accumulation of fluid in the thoracic cavity occurred within 4 h after IP injection of TcsL (20 ng per 25 g bodyweight). Co-injection of TcsL with mouse SEMA6A extracellular domain (mSEMA6A-ECD) at 1:1000 and 1:500 (w/w) ratios both reduced accumulation of fluid. Co-injection of TcsL with mouse SEMA6C extracellular domain (mSEMA6C-ECD) at 1:1000 (w/w) ratio did not reduce accumulation of fluid. Injection of Buffer (HBSS, with 0.1% BSA), mSEMA6A-ECD alone, or mSEMA6C-ECD alone were examined in parallel. Boxes indicate ± s.e.m., error bars indicate ± s.d., *, p < 0.01 (one-way ANOVA). The representative picture of the fluid collected from TcsL and TcsL + mSEMA6A-ECD groups are shown in panel B.
(D) Experiments were carried as described in panel C and the edema in lung tissues was evaluated by measuring the dry-to-wet weights. TcsL reduced dry-to-wet weight ratio of lung tissue 4 h after the injection compared with the Buffer group and the mSEMA6A-ECD alone group. Co-injection of TcsL with mSEMA6A-ECD prevented this reduction, while co-injection with mSEMA6C-ECD showed no protection from TcsL. Boxes indicate ± s.e.m., error bars indicate ± s.d., *, p < 0.01 (one-way ANOVA).
(E) Experiments were carried as described in panel C, and the indicated lung tissues were harvested and subjected to histological analysis by H&E staining. TcsL resulted in alveolar hemorrhage (upper panels) and widening of perivascular space (black arrows in lower panels). These pathological changes are reduced in the TcsL + mSEMA6A-ECD groups. Scale bar, 200 μm.
