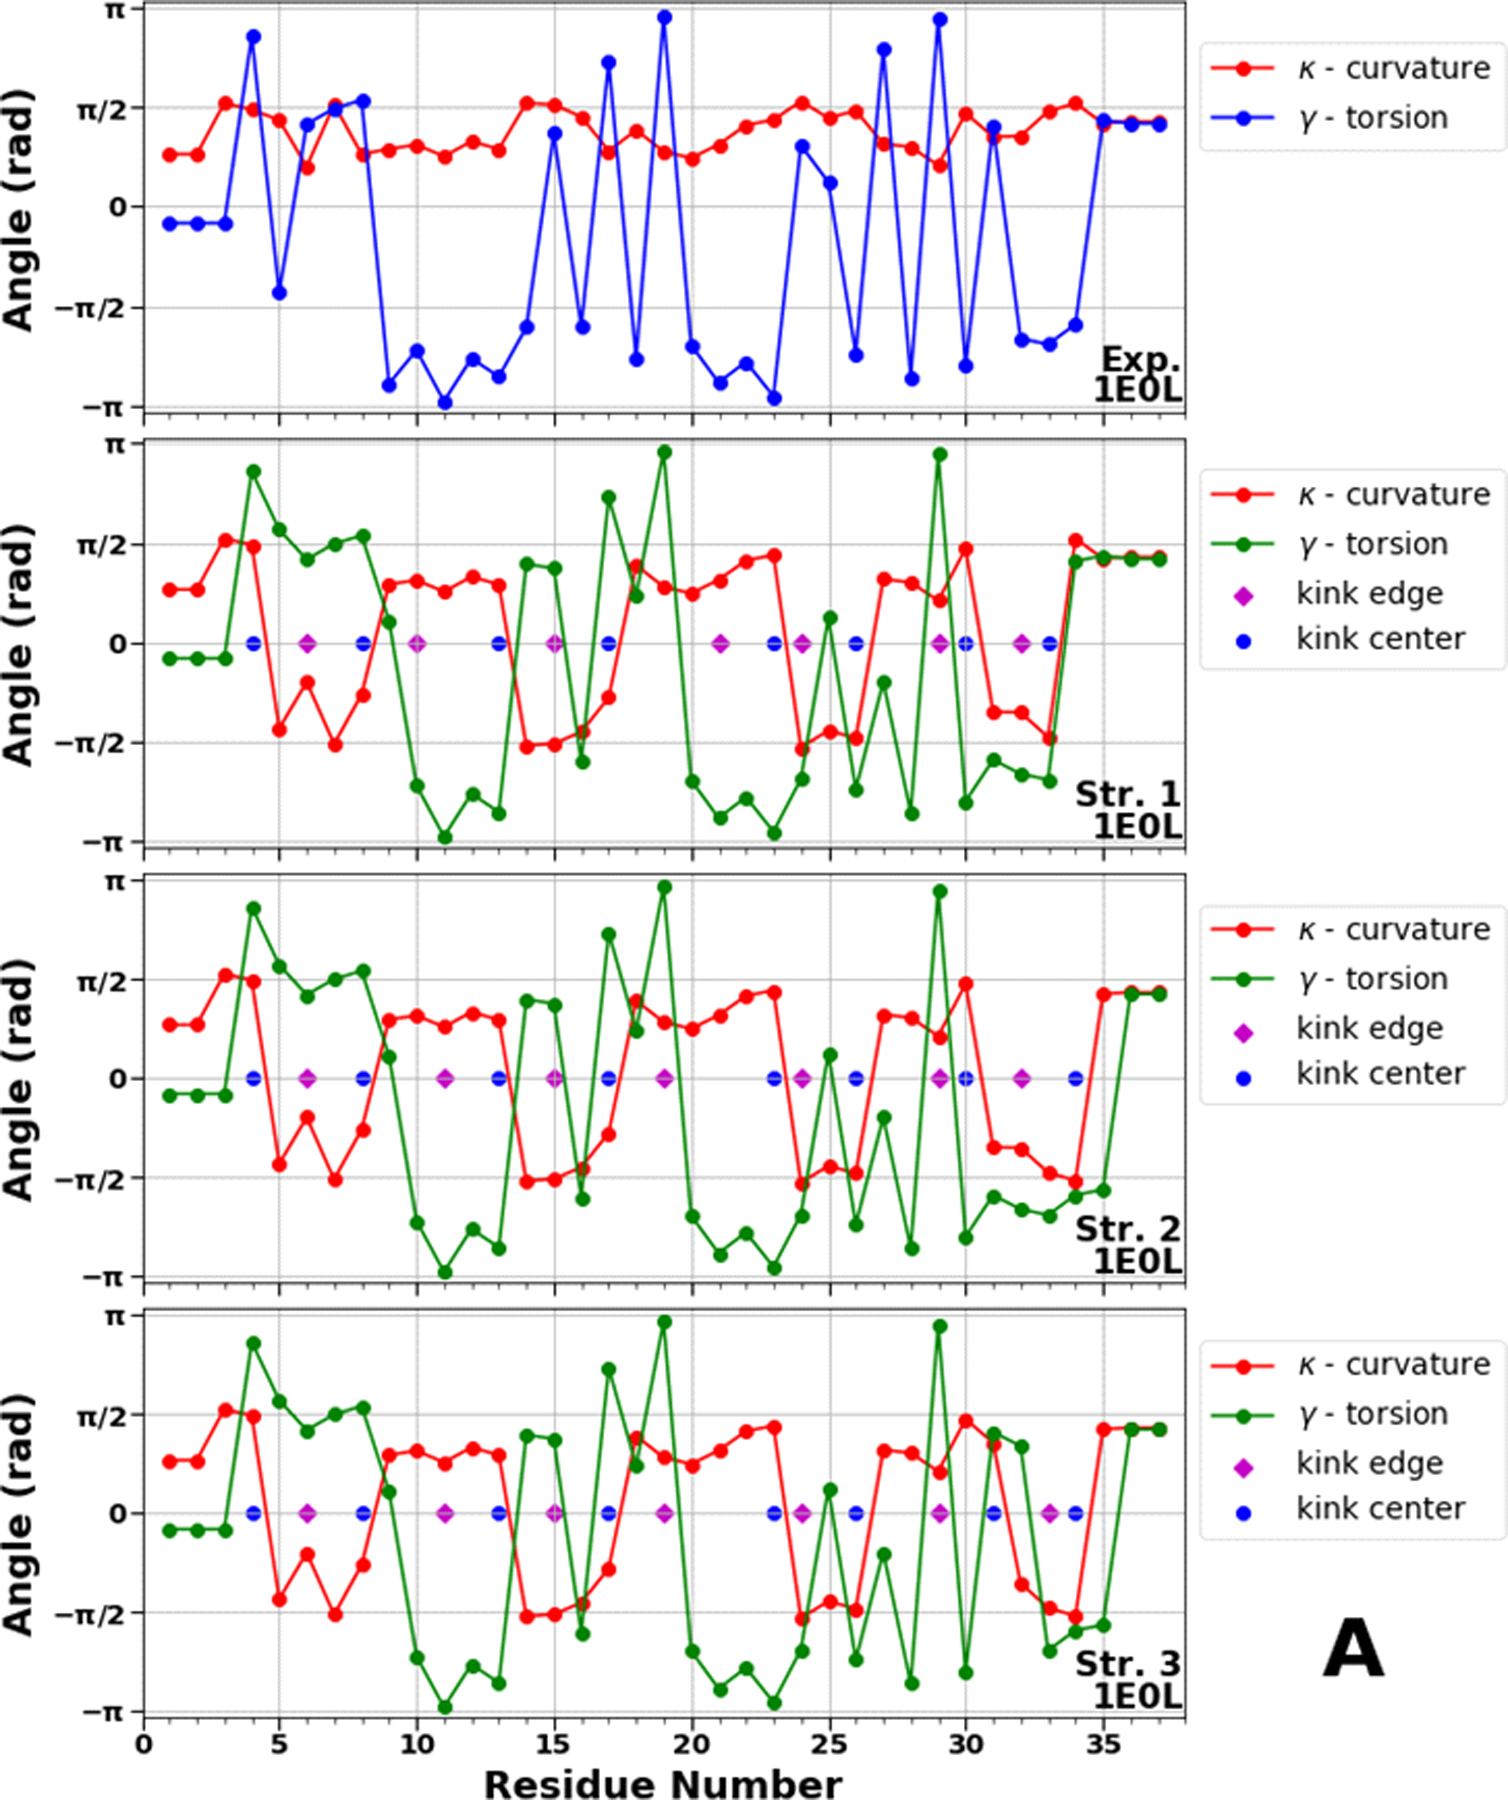
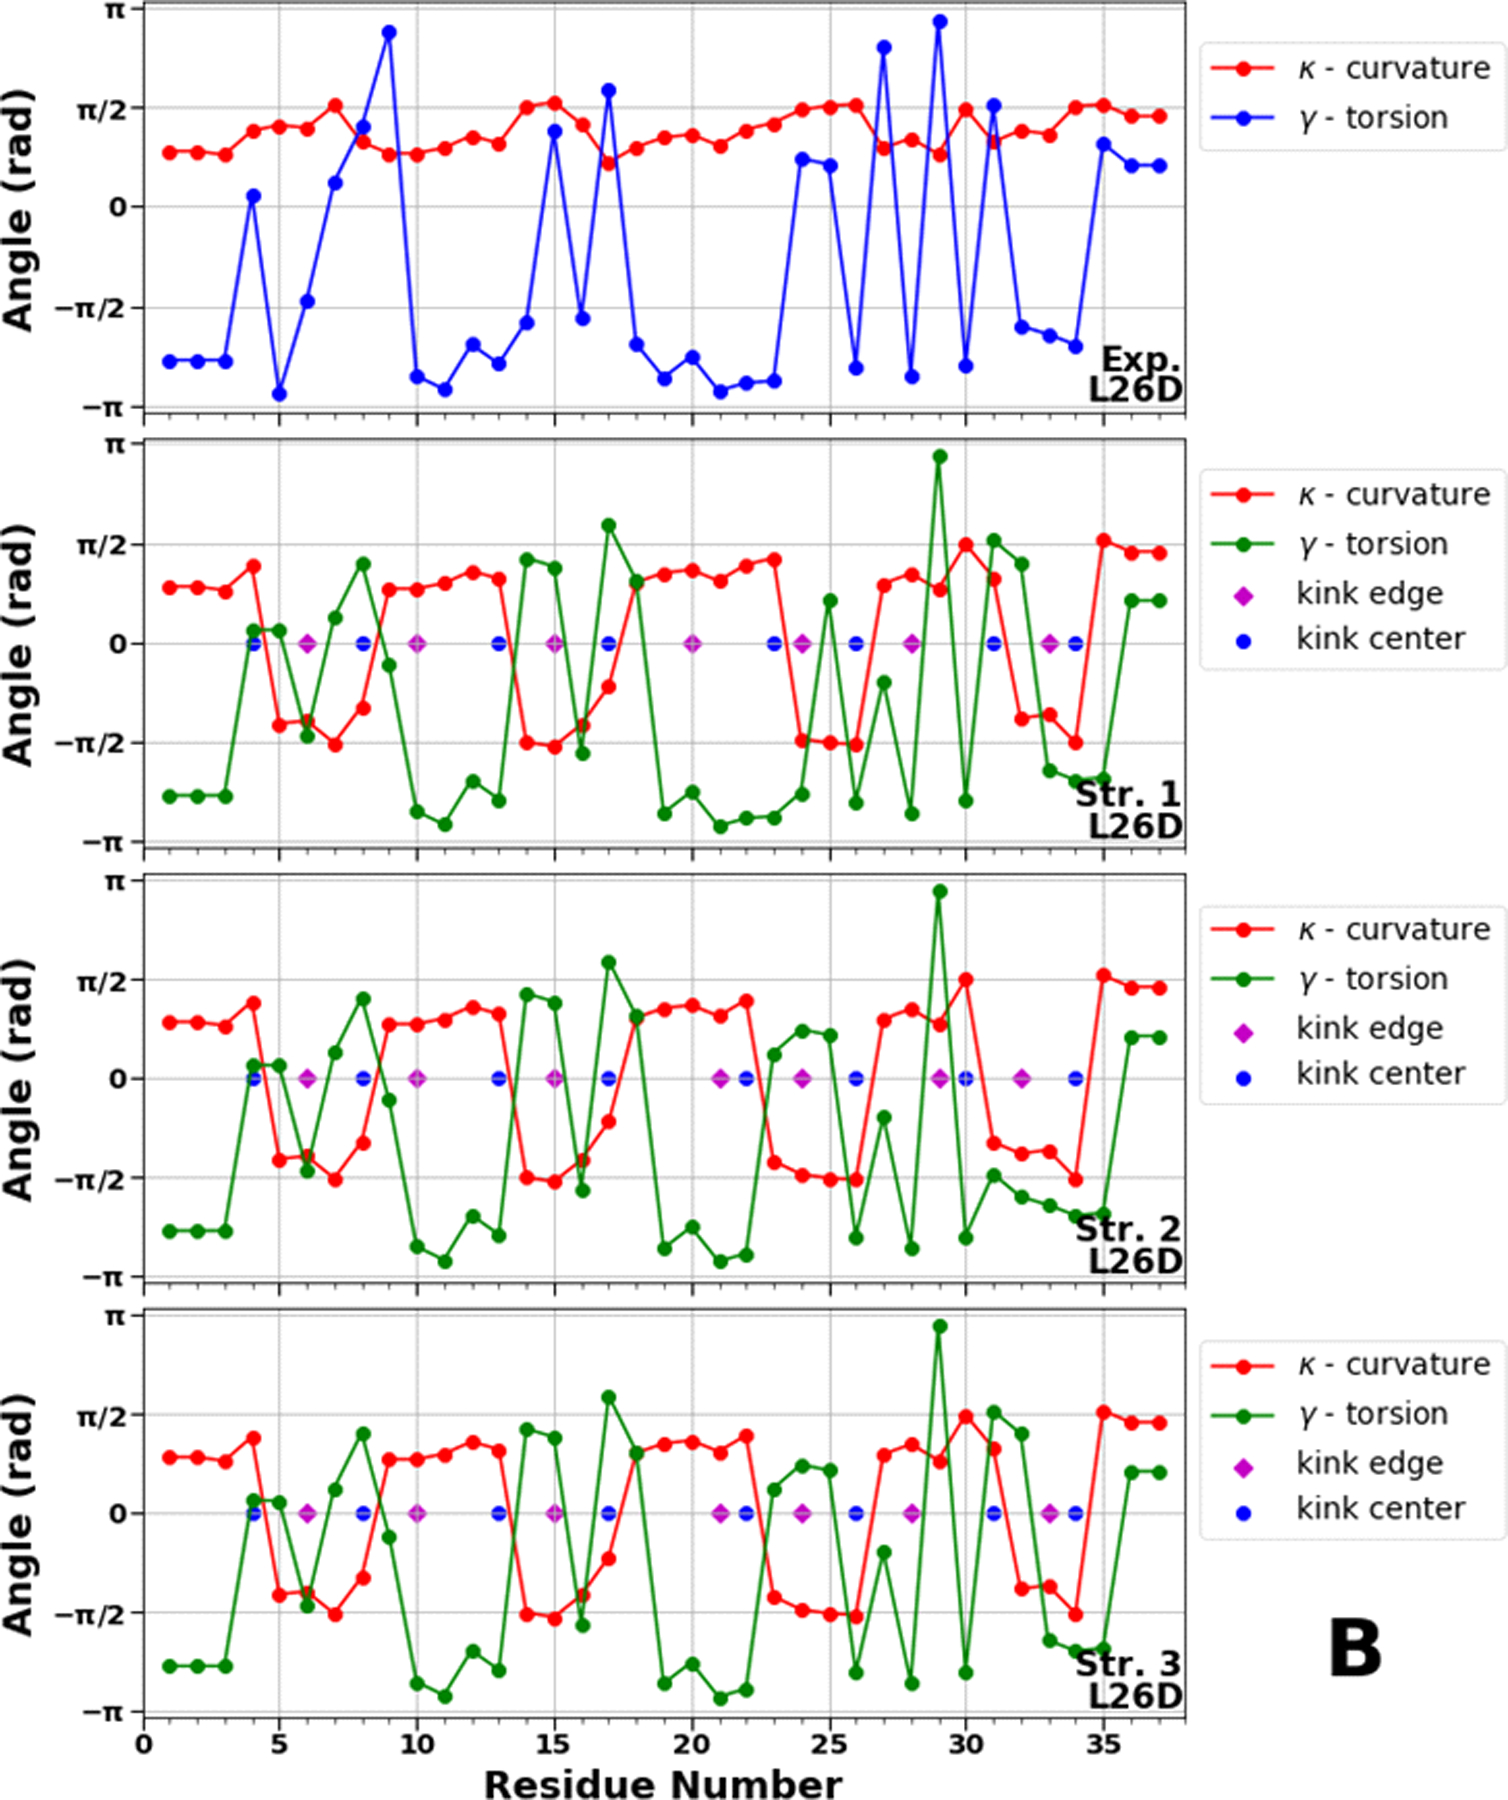
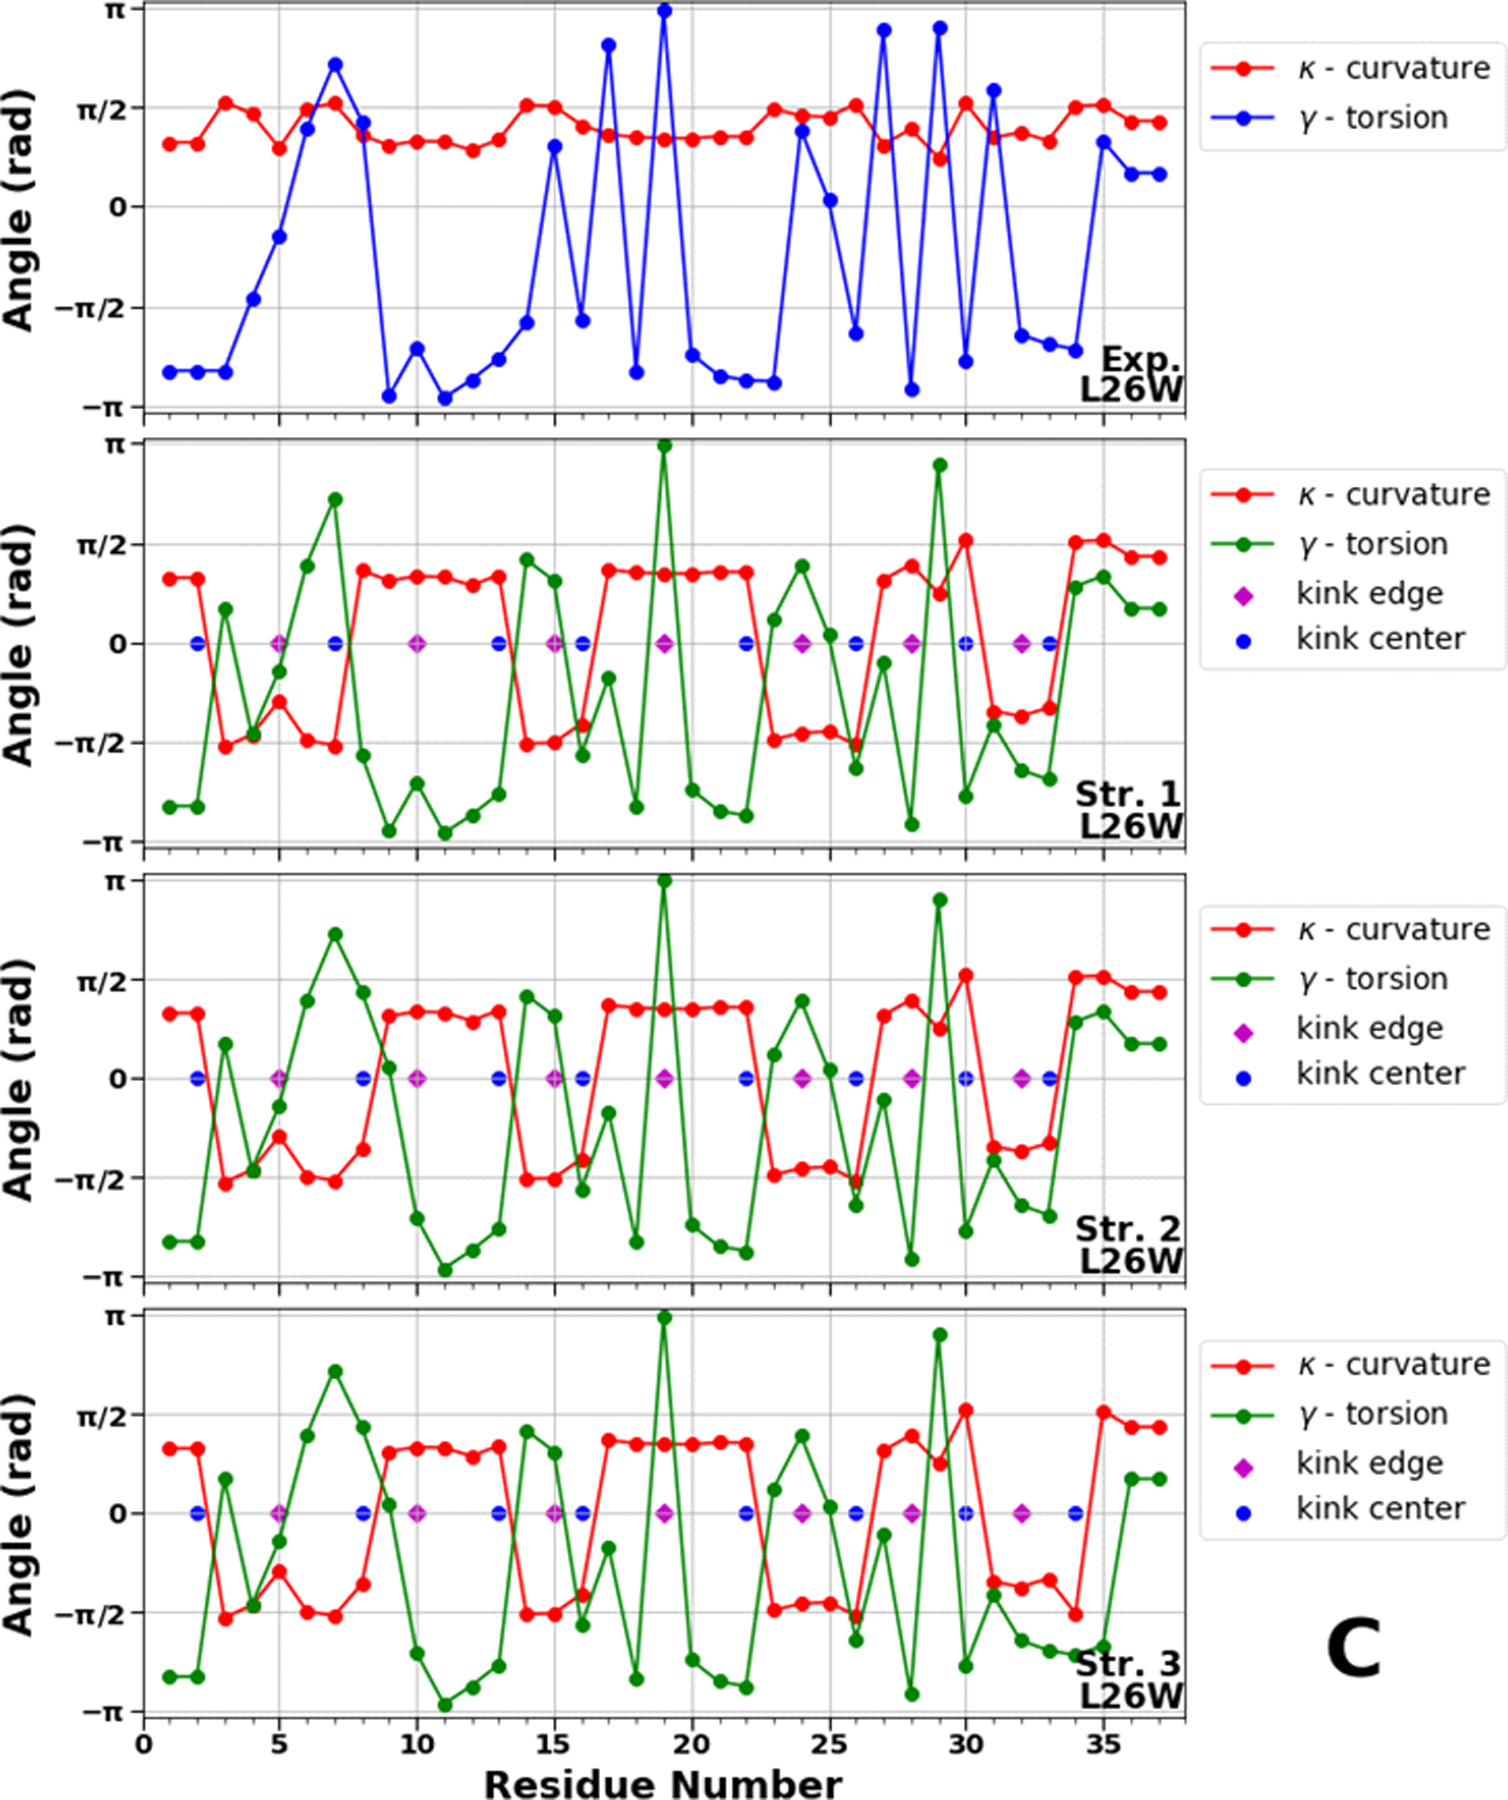
Figure 8.


Top panels of A, B and C represent experimental values of the virtual-bond κi (red) and torsion γi (blue) angle spectra of 1E0L (panel A), 2N4R (panel B) and 2N4T (panel C). Remaining three panels in A, B and C illustrate kink structures, i.e., the virtual-bond κi (red) and torsion γi (green) angle spectra for three selected structures of 1E0L (panel A), 2N4R (panel B) and 2N4T (panel C), after ℤ2 gauge transformation (eq. 8) was made. Blue circles represent centers of kinks, purple rhombuses represent the right edges of left kinks.
