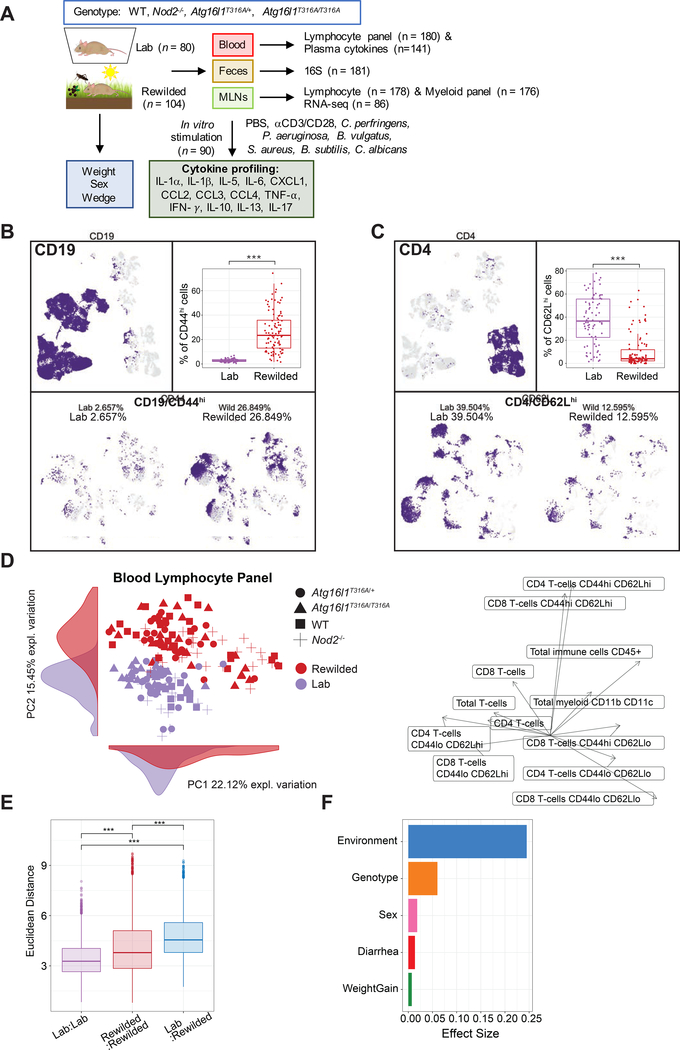
Figure 1. Environmental change drives inter-individual variation in immune cell populations.
(A) 25 C57BL/6+/+, 28 Nod2−/−, 27 Atg16l1T316A/+, 24 Atg16l1T3I6A/T3I6A mice (total=104) were housed in the wild enclosure (Rewilded) for 6–7 weeks and successfully trapped for flow cytometry analysis of lymphoid and myeloid cell populations in the blood and mesenteric lymph nodes (MLNs). Plasma was also collected for cytokine profiles. Age matched 19 C57BL/6+/+, 19 Nod2−/−, 20 Atg16l1T316A/+, 22 Atg16l1T316A/T316A mice (total=80) housed under SPF conditions (Lab) were analyzed as controls. Feces were collected for 16S rRNA sequencing. MLN cells were cultured with indicated stimulates for 48 hours and supernatants were collected for cytokine profiling. Samples that fail quality control are not included in downstream analyses. (B and C) UMAP projections of ~180,000 CD45+, ~110,000 CD19+, and ~36,000 CD4+ cells on flow cytometry data of the blood from lab and rewilded mice. Events are color-coded according to CD19, CD44 (B), CD4, and CD62L (C) fluorescence level. Box plots show the abundance of CD44hi CD19+ cells (B) and CD62Lhi CD4+ cells (C) in the blood of individual lab and rewilded mice. (D) Principal component analysis (PCA) of gated immune cell populations in the blood and the density of each population along the principal component (PC). Right panel indicate biplots of the gated immune cell populations that are projected onto PC1 and PC2. (E) Box plot of pairwise Euclidean distance measures based on blood immune cell population in the blood of lab versus lab, rewilded versus rewilded and lab versus rewilded mice. (F) Bar plot showing the pseudo R2 measure of effect size on the entire distance matrix used to calculate the PCA of immune cell populations in the blood (D). ***P < 0.001 by Kruskal-Wallis test between groups (B, C) and ***P < 0.001 by Mann-Whitney-Wilcoxon test between groups (E).

