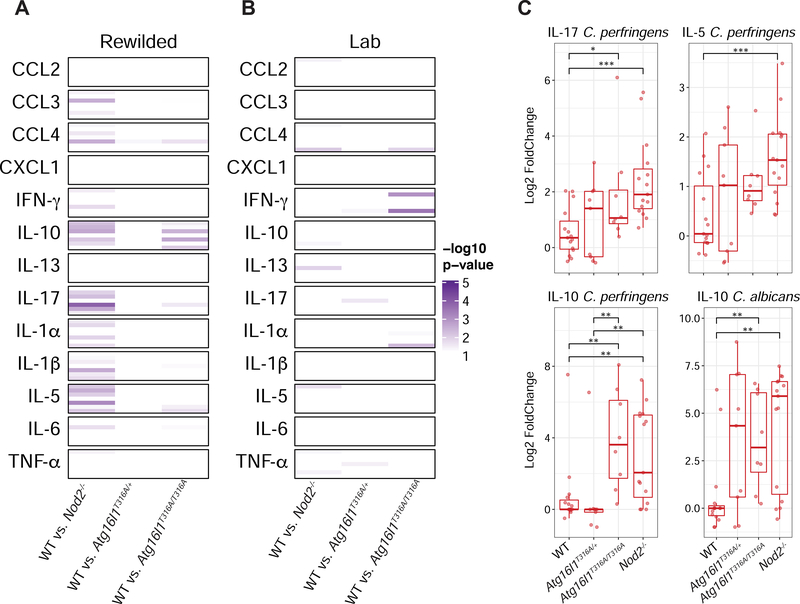
Figure 3. Rewilded Nod2−/− mice display greater changes in cytokine production compared to rewilded WT mice.
(A to C) MLN cells from lab and rewilded mice were ex vivo cultured with B. subtilis, S. aureus, C. perfringens, B. vulgatus, P. aeruginosa, C. albicans, and αCD3/CD28 beads for 48 hours and the supernatants were assayed for 13 cytokines. (A and B) Heatmap of significant p-values from Mann-Whitney-Wilcoxon test between group results comparing fold changes of stimulated cytokine production in rewilded (A) and lab (B) WT mice against Nod2−/−, Atg16l1T316A/+ and Atg16l1T316A/T316A mice respectively. Within each cytokine condition the order of stimulation remains constant as follows; B. subtilis, B. vulgatus. C. albicans, aCD3/CD28, C. perfringens, P. aeruginosa, S. aureus. (C) Representative box plots of the most significant changes between WT and Nod2−/− mice. * P <0.05, ** P <0.01, *** P < 0.001 by Mann-Whitney-Wilcoxon test between groups (C).

