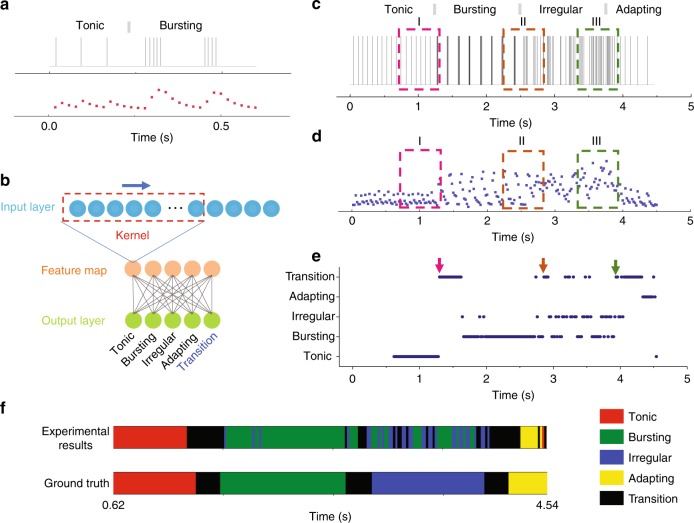
Fig. 4. Real-time analysis of neural firing pattern evolution.
a A spike train showing “Tonic → Bursting” transition (upper), and the corresponding simulated device current (bottom). b The bilayer CNN used as the readout layer. A 27 × 1 kernel is used to project the reservoir states onto a 5 × 1 feature map, which is then applied to the fully connected layer for firing pattern recognition. c and d A streaming spike train used for evaluation c, and the corresponding experimentally measured device responses d. The gray bars mark the transition between different patterns. e Output from the RC system for the input stream in a. The arrows indicate the moments when the pattern transitions began to be detected. f Experimental results from the RC system (upper) vs. ground truth (bottom), represented by color maps.

