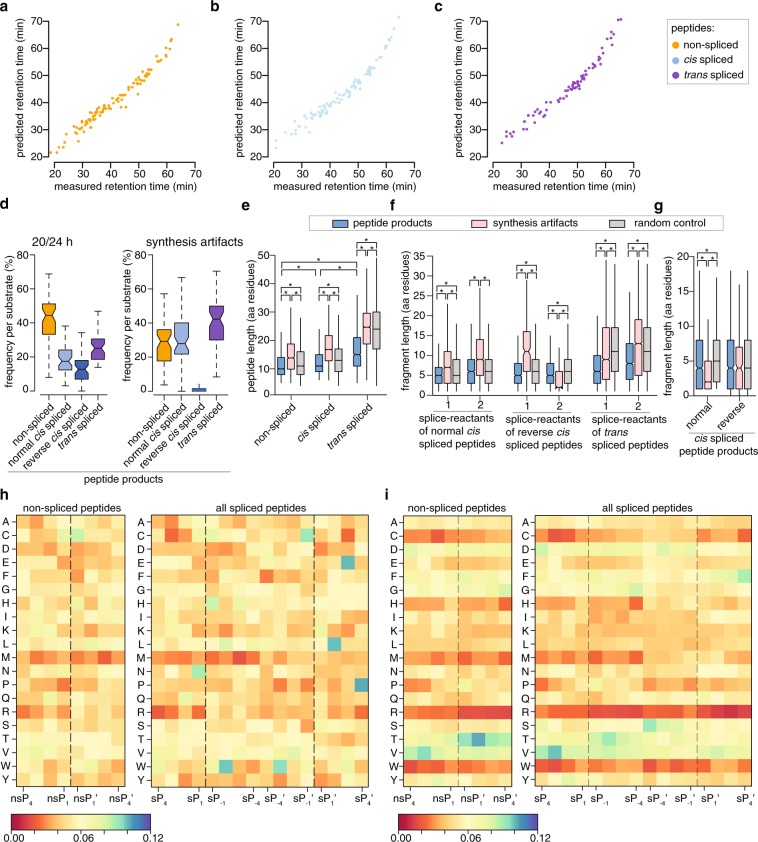
Fig. 3.
Database validations and characteristics of spliced and non-spliced peptides products. (a-c) Comparison of measured and predicted retention time of non-spliced, cis and trans spliced peptides identified in our database. Non-spliced peptides were used to train a retention time model (a), which was then used to predict the retention times of identified cis spliced (b) and trans spliced peptides (c). (d,e) Relative frequency (d) and length distribution (e) of non-spliced, cis spliced and trans spliced unique peptides generated after 20/24 h digestion by 20S s-proteasomes. This analysis is done on unique peptide sequences (i.e. unique sequences identified per substrate). For database validation, length distribution of synthesis artifacts (d,e) and of random control dataset (e) are shown. (f,g) Length distribution of N-terminal (splice-reactant 1) and C-terminal (splice-reactant 2) splice-reactants (f) and intervening sequence length distribution (g) of spliced peptide products detected in 20/24 h in vitro digestions with 20S s-proteasomes are shown. As comparison, length distribution of synthesis artifacts and of random control dataset are shown. Statistically significant comparisons are labeled with * and the related p values are reported in Table 2. (h,i) Matrixes of the amino acid frequency, in the position enumerated in Fig. 1, of non-spliced and spliced peptide products generated by 20S s-proteasomes after 20/24 h (h) and synthesis artifacts identified in control samples (i).

