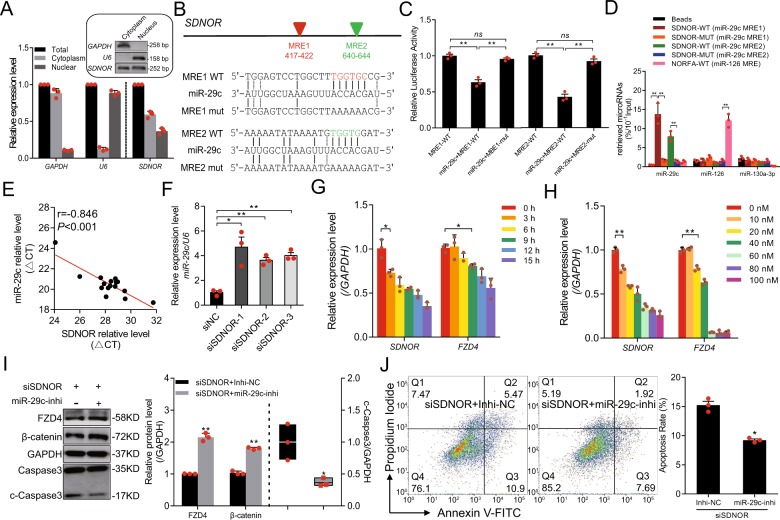
Fig. 6. SDNOR maintains the expression of FZD4 by physically interacting with miR-29c.
a Subcellular localization of SDNOR in porcine GCs, detected by qRT-PCR. The gel images in the box showing the semi-qPCR results. GAPDH and U6 served as markers for cytoplasm and nucleus, respectively. b Schematic diagram represents SDNOR transcript (top) and recombinant reporter vectors with wild-type or mutant miR-29c response elements (MRE) (bottom). Predicted miR-29c MREs shown with colored triangles. c Luciferase activities of reporter vectors in porcine GCs with or without miR-29c. d RNA pull-down analysis for miR-29c following pull-down with biotin-labeled SDNOR, further assessed by qRT-PCR. miR-126 and miR-130a-3p here were used as negative controls. e SDNOR and miR-29c expression levels in 16 porcine ovarian follicles were detected and subjected to Pearson correlation analysis. f miR-29c expression levels in porcine GCs after SDNOR knockdown, determined by qRT-PCR. SDNOR and FZD4 mRNA levels in porcine GCs transfected with miR-29c for different time (g, 0–15 h) or at different concentration (h, 0–100 nM), assessed by qRT-PCR. i Western blot analysis (left) and quantification (right) of FZD4, β-catenin and c-Caspase-3 protein levels in porcine GCs after SDNOR and miR-29c knockdown. GAPDH used as a loading control. j FACS analysis (left) and quantification (right) of the apoptosis rate of porcine GCs after SDNOR and miR-29c knockdown. Data in a, c, d, and f–i are shown as mean ± S.E.M. (n = 3, each). *p < 0.05, **p < 0.01 and ns indicates no significance versus to control or scrambled.

