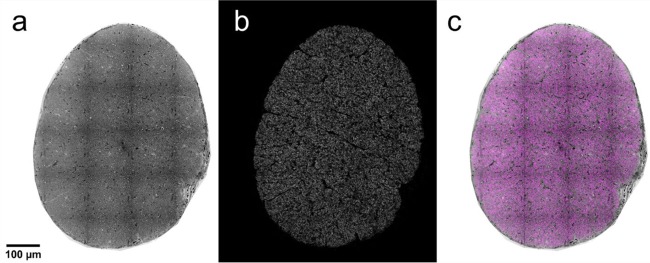
Figure 8.
AxoNet Plugin Results. After using the AxoNet plugin for ImageJ and Fiji on an image of a full rat optic nerve (a), the output axon density map (b) and the combination of these two images (c) are displayed. The combination of these two images is shown with the input image (a) in greyscale and the axon density map (b) overlaid in pink. Axon density scale is not provided here because these full images are scaled down significantly for inclusion in the manuscript and color scale is indistinguishable at this resolution. A grid of dark lines is visible in panel a; these lines correspond to tile edges from the microscopy imaging and are an artifact of visualization only since counts are carried out on much smaller portions of the full image.

