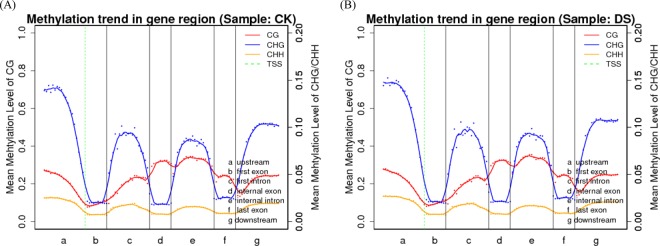
Figure 3.
Canonical DNA methylation profiles of the entire transcriptional units. The canonical gene structure is defined by 7 different features, which are displayed on the x-axis. The length of features were normalised and partitioned into equal numbers of bins. Each dot denotes the mean methylation level per bin and lines denote 5-bin moving averages. The green vertical lines indicate the mean locations of transcriptional start sites.

