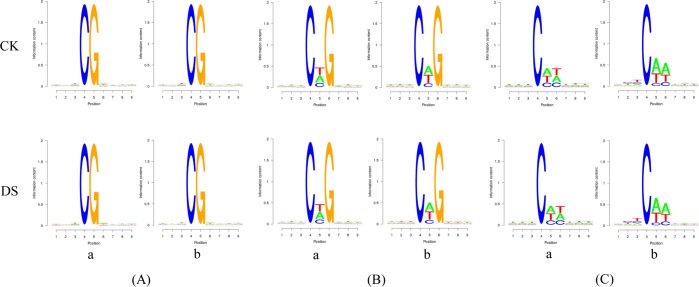
Figure 4.
Sequence preference for cytosine DNA methylation. Weblogo analysis of bases surrounding mC sites within different sequence contexts. The X axis represents the position of bases in which the methylated cytosine is placed in the fourth position. The Y axis indicates the entropy of the base. (A), (B) and (C) represent CG, CHG and CHH sequence contexts, respectively. Further, a and b represent all C sites and mC sites, respectively.

