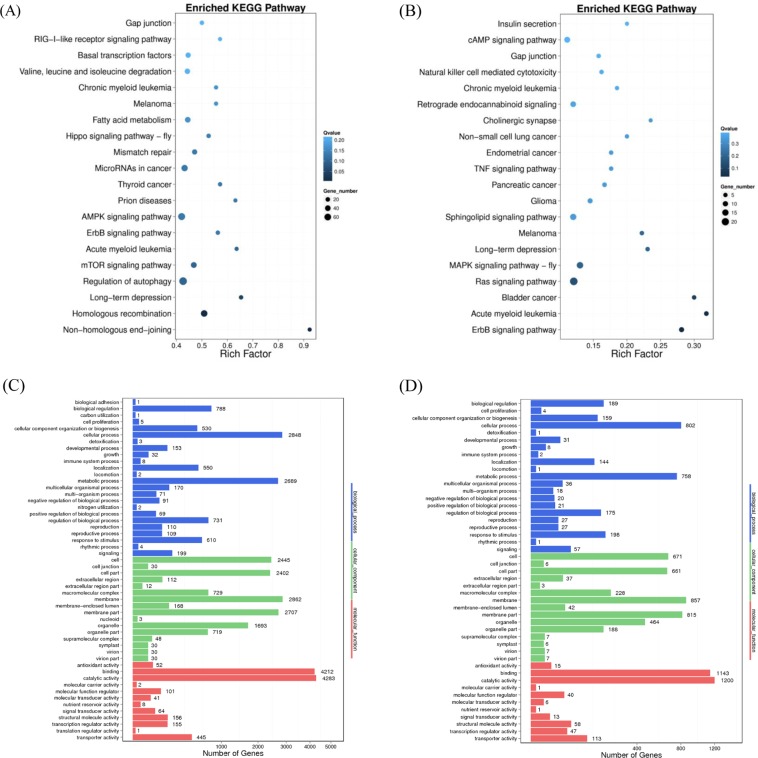
Figure 5.
KEGG pathway enrichment and GO analysis of DMGs and DMPs which located in DMRs. (A) KEGG pathway enrichment of DMGs and (B) KEGG pathway enrichment of DMPs is shown. The size of each circle represents gene numbers, and the color represents the q-value. (C) GO analysis of DMGs and (D) GO analysis of DMPs is shown. The x-axis represents three domains of GO while y-axis represents the gene numbers within each pathway and processes.

