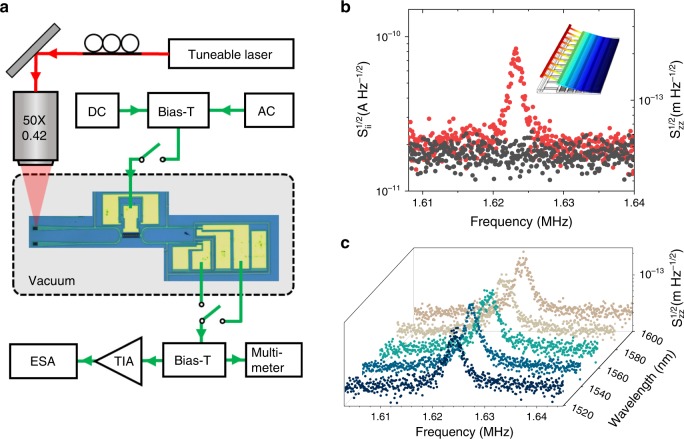
Fig. 5. Experimental set-up and the measurement of the thermal noise.
a Schematics of the thermal noise measurement setup. b Photocurrent (left axis) and displacement (right axis) spectral density, measured by the ESA with (red circles) and without (black circles) laser (λ = 1540 nm, on-chip power 0.3 mW, actuator bias voltage 1.5 V), showing a peak corresponding to the Brownian motion of the fundamental mechanical mode. Inset: Calculated mode shape of fundamental mechanical mode. c Brownian motion measured at different wavelengths.

