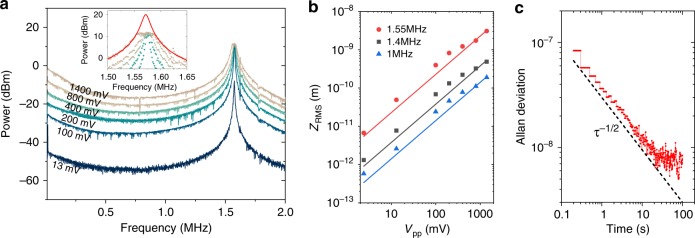
Fig. 6. Response of the sensor driven by an oscillating voltage.
a Driven-response spectra for various driving amplitude measured with a 50 Hz resolution bandwidth. A −1 V DC bias is applied for Vpp from 13 mV to 800 mV. For Vpp = 1.4 V a −1.4 V DC bias is used. Inset: Zoom-in of the spectra around at the resonance, with a Lorentzian fit of the 1.4 V modulation data. Laser wavelength is 1540 nm and on-chip power 0.3 mW. b Root mean square displacement of cantilever as a function of peak-to-peak voltage at 1.55 MHz, 1.4 MHz and 1 MHz. Dots are measurement data and solid lines are linear fits. c Allan deviation as a function of integration time. The τ−1/2 slope is indicated with dashed line, where τ is the integration time.

