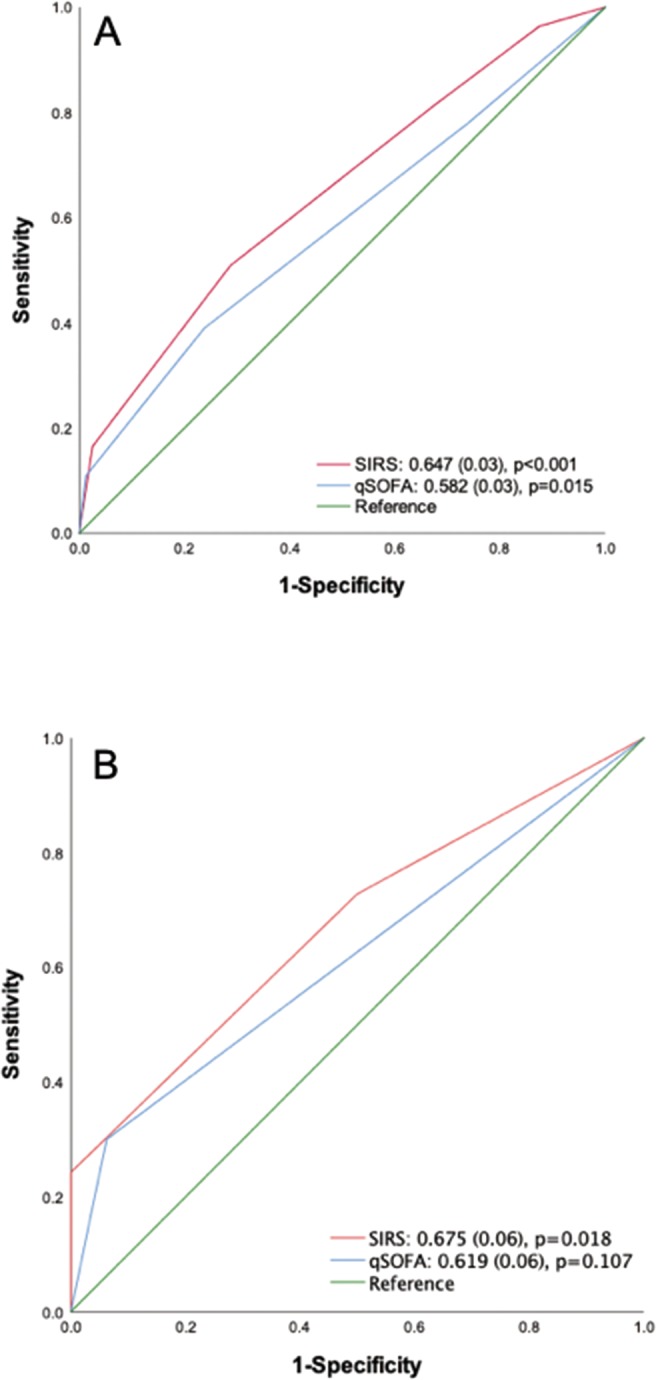
Figure 4.

Receiver operating characteristic (ROC) curve analyses for predicting an ultimately established diagnosis of infection in patients with suspected infection at the presentation to the emergency department. (A), All patients presented to the emergency department; (B), Patients who met both the SIRS criteria and qSOFA score. Numbers indicate the AUC (SE), p-value. AUC, area under the ROC curve; qSOFA, quick sequential organ failure assessment; SE, standard error; SIRS, systemic inflammatory response syndrome.
