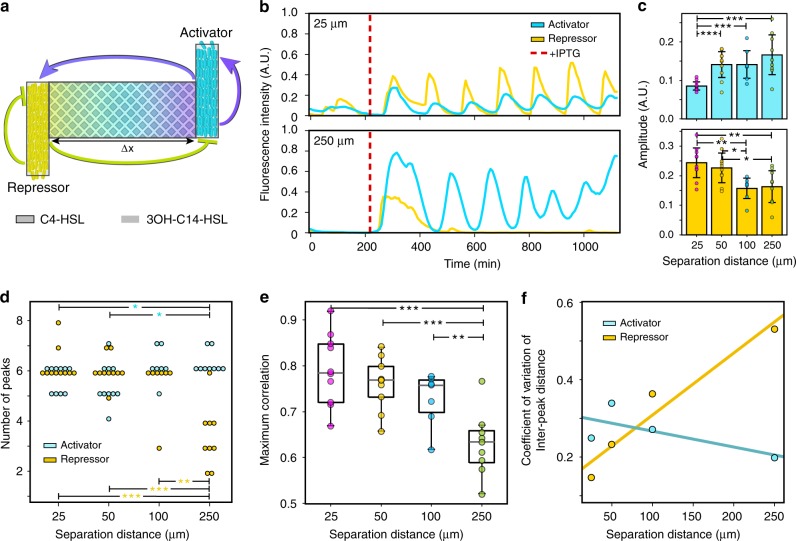
Fig. 4. Feedback loops dictate the role of distance on a distributed gene circuit oscillator.
a Network schematic of activator and repressor strains in the MISTiC device. The activator and repressor exhibit bidirectional communication and dual-feedback loops mediated by the signaling molecules C4-HSL and 3OH-C14-HSL. The activator and repressor exhibit positive and negative feedback loops, respectively. b Representative normalized CFP and YFP fluorescence intensities as a function of time in the 25 μm (top) and 250 μm (bottom) conditions. The red line indicates the time of induction with 1 mM IPTG. c Amplitude of peaks in the mean-subtracted CFP (top) and YFP (bottom) fluorescence intensities across distances. Error bars represent 1 SD from the mean. Horizontal lines with stars denote a statistically significant difference (P < 0.05) based on a two-sided t-test. *P < 0.05, **P < 0.01, ***P < 0.001 (Supplementary Fig. 16). d The number of peaks as a function of distance for activator and repressor strains. Horizontal lines denote a statistically significant difference (P < 0.05) based on a two-sided t-test. *P < 0.05, **P < 0.01, and ***P < 0.001 (Supplementary Fig. 16). e Maximum cross-correlation between paired CFP and YFP time-series measurements for each distance. The horizontal lines within boxes denote the median and upper and lower edges represent the upper and lower quartiles, respectively. Upper and lower whiskers represent the 95th and 5th confidence intervals, respectively. Horizontal lines with stars denote a statistically significant difference (P < 0.05) based on a two-sided t-test. *P < 0.05, **P < 0.01, and ***P < 0.001 (Supplementary Fig. 16). f The coefficient of variation of the inter-peak distances (phase drift) as a function of separation distance for activator and repressor strains. Lines represent linear regression fits to the data. Source data are provided as a Source Data file.

