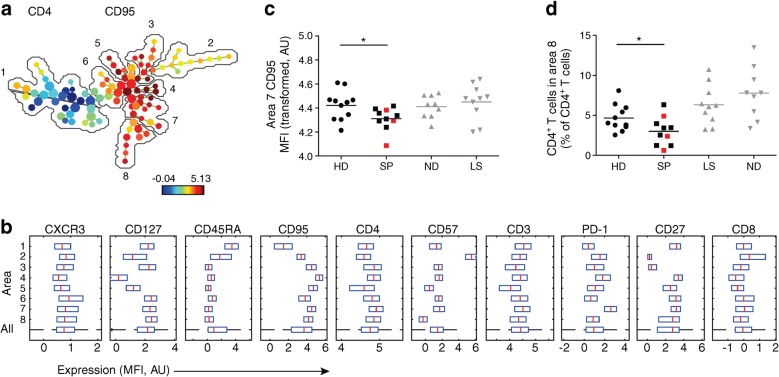
Fig. 3.
Phenotypic characteristics of T cells in slow progressors indicate decreased CD95 expression and a decreased percentage of central memory T cells. Expression of the indicated markers was assessed using flow cytometry. (a) SPADE image of pooled CD4+ T cells from all participants, auto-partitioned into eight annotated areas with node size scaled to the log number of cells in each node, showing median CD95 expression as a heatmap. Based on the expression of CD27 and CD45RA, the cells in the different areas were designated as follows: area 1, naive (CD27+CD45RA+); area 2, effector (CD27−CD45RAint); area 3, effector memory (CD27−CD45RA−); areas 4–8, memory (CD27int/+CD45RA−). (b) SPADE boxplots showing marker distribution in each area or in all areas for the pooled CD4+ T cell samples depicted in (a). Central red lines indicate median values and the ends of blue boxes indicate interquartile ranges. The dashed horizontal line at the bottom indicates the ‘All’ category. (c) CD95 expression (transformed values) in CD4+ T cell area 7 for each participant. (d) Percentage of CD4+ T cells in CD4+ T cell area 8 for each participant. In (c) and (d), horizontal lines indicate mean values and red squares denote slow progressors who tested seropositive for a single islet autoantibody at the time of immune cell analysis. *p < 0.05 for slow progressors vs healthy donors (determined using an unpaired Student’s t test). Results for people with newly diagnosed and long-standing type 1 diabetes are shown in grey to add context but were not included in statistical analysis due to small sample sizes and lack of age matching between newly diagnosed and slow-progressing individuals. AU, arbitrary unit; HD, healthy donors; LS, long-standing type 1 diabetes; MFI, median fluorescence intensity; ND, newly diagnosed type 1 diabetes; SP, slow progressors

