Fig. 6.
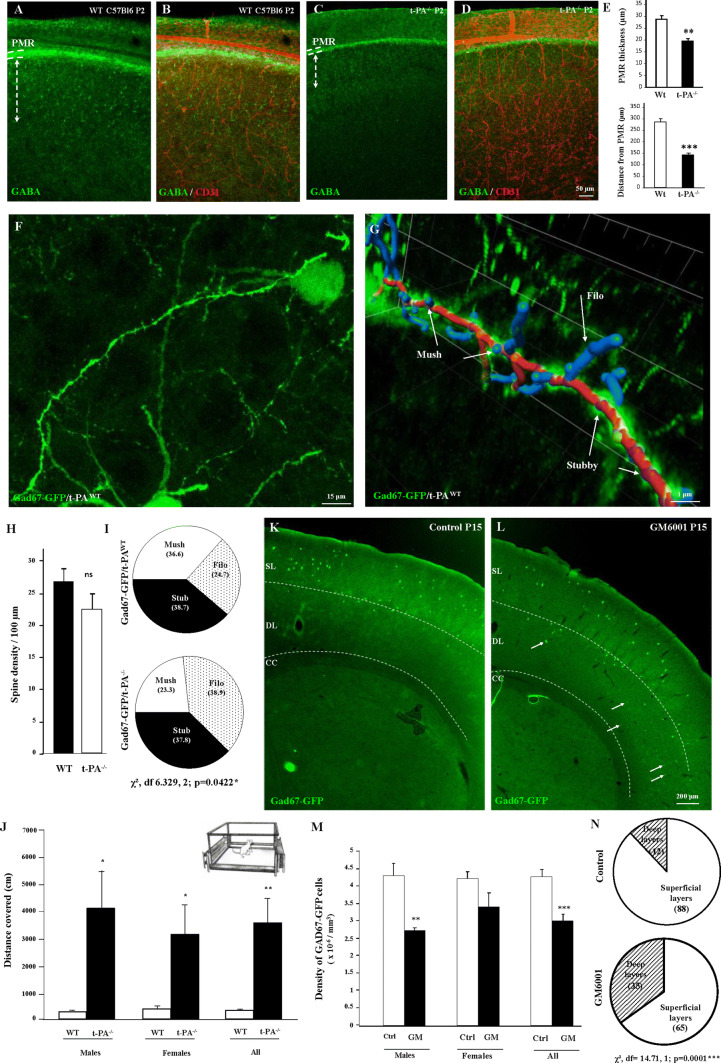
Effects of t-PA invalidation and in vivo GM6001 exposure on the cortical positioning and the spine morphology of GABA interneurons populating the superficial cortical layers. a–e Visualization of GABA interneurons (a–c) and microvessels (b, d) in P2 cortical slices from wild-type (a, b) and t-PA null (c, d) mice. Note the reduction of the PMR thickness (b, d, e, upper panel) and the reduced distance of GABA interneurons from the PMR (b, d, e, lower panel) in t-PA null mice. f Visualization of a Gad67-GFP neuron presenting dendritic spines in the superficial cortical layers of a wild-type mouse at P15. g Illustration of a graphic design obtained after spine analysis performed with the Filament tracer tool from the Imaris software. Three spine subtypes were analyzed: filopodia (Filo), mushrooms (Mush), and stubbies (Stub). Fiber is colored in red, mushrooms, and filopodia in blue, stubby in purple. h, i Quantification of the spine density (h) and the distribution of spine subtypes (i) in wild-type and t-PA−/− mice at P15. j Quantification of the locomotor activity of wild-type and t-PA−/− mice at P15. k–m Visualization (k, l) and quantification (m) of the positioning of Gad67-GFP neurons at P15 in control (k, m) and in vivo-exposed mice to the MMP inhibitor GM6001 (10 mg/kg; l, m). Note the presence of numerous ectopic cells in deep layers (l; arrows). n Quantification of the distribution of Gad67-GFP neurons between superficial and deep cortical layers in control and GM6001-treated mice. ns not significant; *p < 0.05; **p < 0.01; ***p < 0.001 vs wild-type or control mice. The tests used for the statistical analysis, the number of independent experiments, the number of measures per experiment, and p values are detailed in Table 1

