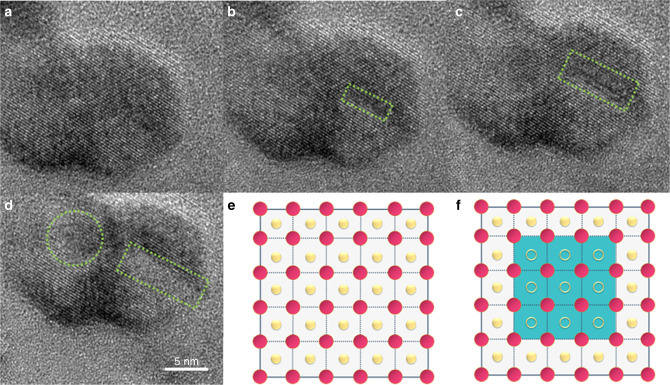
Fig. 2. In situ high-resolution environmental transmission electron microscopy (HRETEM) observations of the In2O3 + xH2 → In2O3−x + xH2O process.
High-resolution images of a stoichiometric In2O3 nanocrystal (S1) at 400 °C a under an N2 atmosphere and then switched to an H2 atmosphere for the following times: b 5 min, c 10 min and d 20 min. Scale bars are the same for all images, green squares indicate the formation of an amorphous phase. Graphical representation of the e original and f treated In2O3, wherein blue region, pink dots, yellow dots and yellow circles represent amorphous phase, In atoms, O atoms and [O], respectively.

