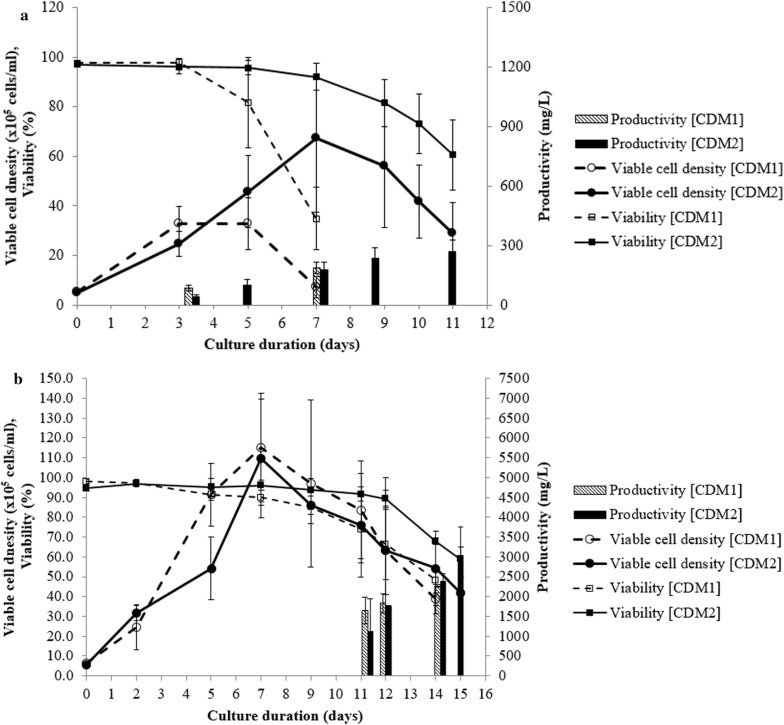
Fig. 5.
Comparing cell culture data of CDM1 derived clones and CDM2 derived clones a batch culture (no feed) data of top clones from CDM1 and CDM2 (average of 20 clones, error bar is standard deviation), b fed-batch culture of top clones from CDM1 and CDM2 (average of 3 clones, error bar is standard deviation), CDM1 data used CDM1 as basal media and CDM2 data uses CDM2 as basal media, for fed-batch the same feed cocktail (Cell Boost 7a and 7b) is used in both CDM1 and CDM2 data at the same shots

