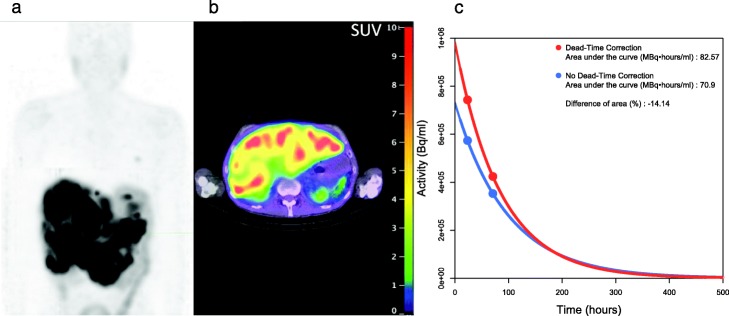
Fig. 3.
Day3 QSPECT maximum intensity projection (a), fused QSPECT/CT slice (b) and renal time-activity concentration curve (c) of a patient with extensive liver metastases who received 28.9 GBq 177Lu-octreotate at his second cycle. The dead time was 22.8% and 16.8% on day 1 and day 3 QSPECT, respectively. The area under the curve–and consequently, the renal absorbed dose – would have been underestimated by 14.1% without dead-time correction

