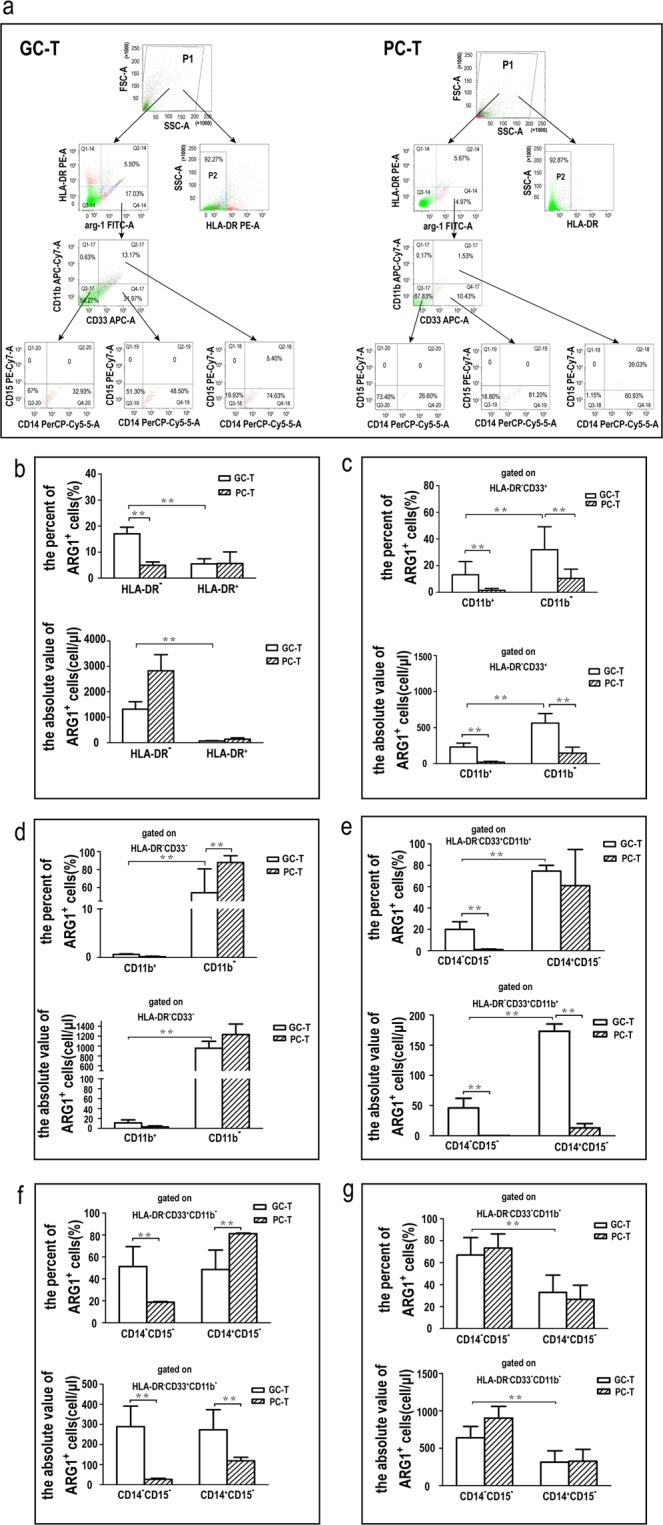
Figure 3.

Percentage and count of ARG1-expressing cells in different immunophenotype tumor-infiltrating MDSCs. (a) Flow cytometry chart of ARG1-expressing MDSCs in gastric cancer tissue (GC-T) and paracancerous tissues (PC-T). Cells were first gated based on the expression of HLA-DR and ARG1. Subsequently, the HLA-DR -/low ARG1+ population were gated based on the expression of CD11b and CD33. The HLA-DR-CD33+CD11b-, HLA-DR-CD33+CD11b+ and HLA-DR-CD33-CD11b- population were gated based on the expression of CD14 and CD15. An isotype control was also run (Supplementary Fig. 2). (b) The percentage and count of ARG1-expressing HLA-DR- mononuclear cells in GC-T or PC-T. (c) Gated on HLA-DR-CD33+, the percentage and count of ARG1-expressing CD11b+ or CD11b- MDSC subsets in GC-T or PC-T. (d) Gated on HLA-DR-CD33-, the percentage and count of ARG1-expressing CD11b+ or CD11b- MDSC subsets in GC-T or PC-T. (e) Gated on HLA-DR-CD33+CD11b+, the percentage and count of ARG1-expressing CD14+CD15- or CD14-CD15-MDSC subsets in GC-T or PC-T. (f) Gated on HLA-DR-CD33+CD11b-, the percentage and count of ARG1-expressing CD14+CD15- or CD14-CD15-MDSC subsets in GC-T or PC-T. (g) Gated on HLA-DR-CD33-CD11b-, The percentage and count of ARG1-expressing CD14+CD15- or CD14-CD15-MDSC subsets in GC-T or PC-T. Values were mean ± SEM (n = 6), **p < 0.01. Paired /Wilcoxon matched-pairs signed rank test or unpaired/Mann–Whitney tests.
