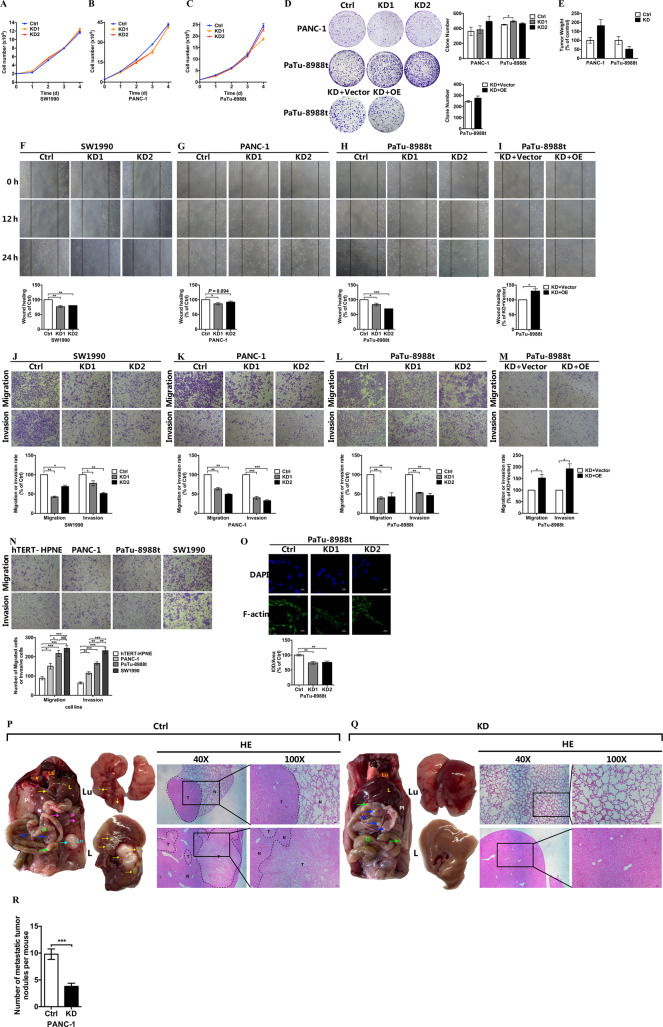
Fig. 2. Expression of COX6B2 modulates metastatic potential of PDAC cells in vitro and in vivo.
a–c Proliferation curves of three stable cell lines (SW1990 (a), PANC-1 (b), PaTu-8988t (c)) with knockdown (KD) of COX6B2 compared with corresponding control (Ctrl) cells. d Colony formation assays of COX6B2 KD PANC-1 (upper panel) and COX6B2 KD PaTu-8988t (middle panel) cells, and cells with re-expression of COX6B2 (lower panel) compared with corresponding control cells. Histograms on the right show the quantitative results, respectively. e Tumor xenograft experiments of PANC-1 and PaTu-8988t cells (5 × 10⁶ cells/mouse). All mice were sacrificed after 9 (PANC-1) or 8 (PaTu-8988t) weeks to measure the final tumor weight. (n = 6 mice per group). f–i Wound healing assays of 3 stable cell lines (SW1990 (f), PANC-1 (g), PaTu-8988t (h)) with knockdown of COX6B2, and of a COX6B2 KD PaTu-8988t cell line with re-expression of COX6B2 (i) compared with corresponding control cells. j–m Transwell assays show the migration (upper panel) and invasion (lower panel) abilities of three stable cell lines (SW1990 (j), PANC-1 (k), PaTu-8988t (l) with knockdown of COX6B2, and cell line with re-expression of COX6B2 (m). n Transwell assays of the HPNE (hTERT-HPNE) normal pancreatic ductal epithelial cell line and five PDAC cell lines as indicated. o Representative immunofluorescence photomicrographs of COX6B2 KD PaTu-8988t cells compared with control cells. Photomicrographs were captured using a confocal laser microscope (600× magnification, scale bar = 25 μm). Actin cytoskeleton and nuclei were stained with anti-F-actin (green) and DAPI (blue), respectively. p, q Representative images of macro-anatomy (left panel), lung (Lu) (middle upper panel), liver (L) (middle lower panel), and paired H&E-stained images after tail vein injection with control PANC-1 cells (p) and PANC-1 cells with KD of COX6B2 (q). For 40× magnification, scale bar = 50 μm; For 100× magnification, scale bar = 20 μm. Arrows indicate metastatic sites in abdominal cavity: gut (G), mesentery (M), pancreatic (P), lymph nodes (Ln), and pleura (Pl). T tumor, N adjacent normal tissue. n = 5 mice per group. r Average number of metastatic tumor nodules in mouse after tail vein injection with control PANC-1 cells and PANC-1 cells with KD of COX6B2. n = 5 mice per group. Histograms show the quantitative results respectively. All data are presented as mean ± SEM (n ≥ 3). *P < 0.05, **P < 0.01 and ***P < 0.001. NS no significance.

