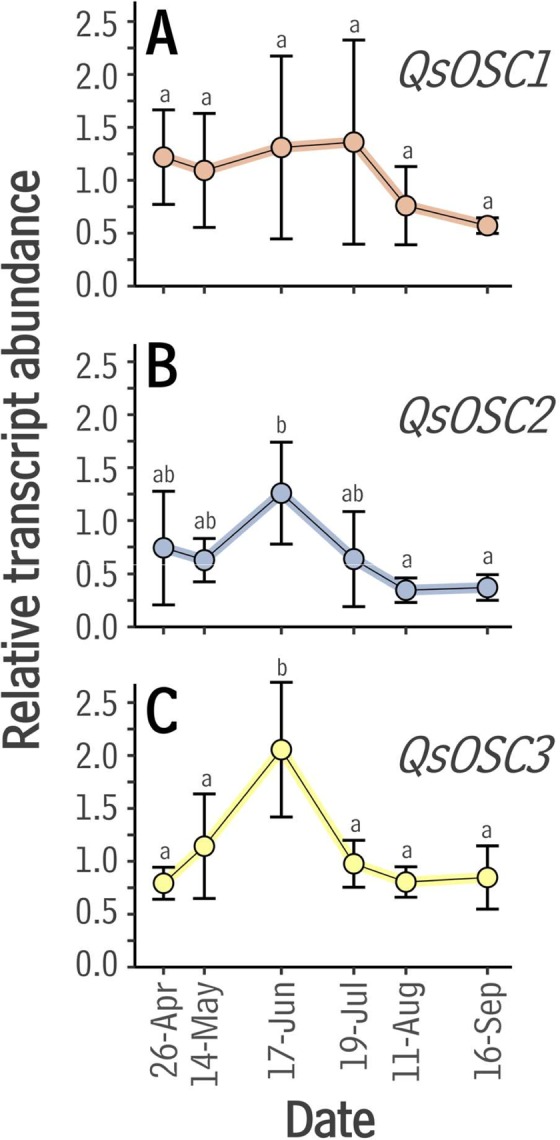
Figure 2.

Expression of candidate OSCs in Quercus suber throughout the growing season as determined by RT-qPCR. The relative abundance of OSC transcripts was calculated by normalization using tubulin as the reference. Bar heights and error bars represent the mean and standard deviation of n = 4 biologically independent measurements. (A) QsOSC1, (B) QsOSC2, (C) QsOSC3. Significant differences (p < 0.05) within each time series were determined using a one-way ANOVA and subsequent Tukey Honest Significant Difference tests.
