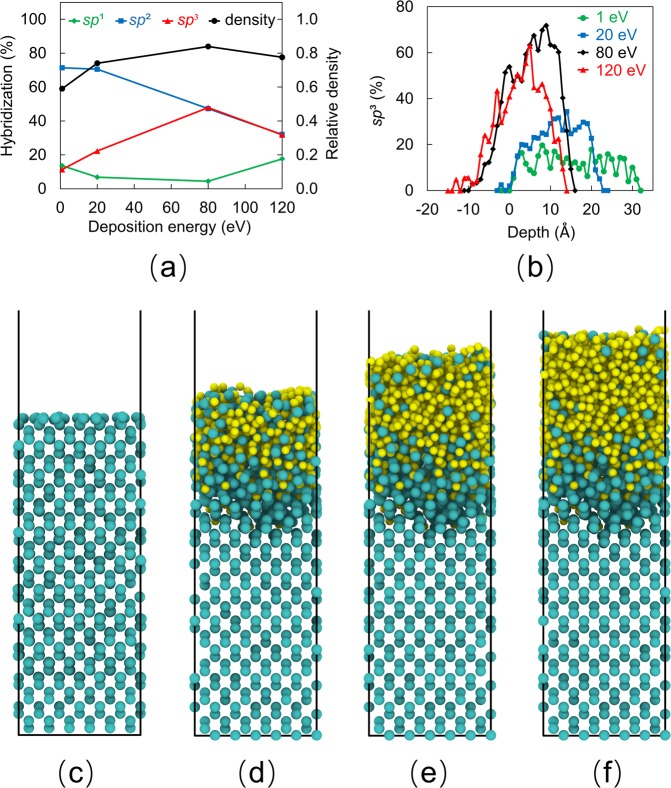
Figure 3.
(a) Variation of sp1, sp2, and sp3 contents and relative density (normalized by the density of diamond) of a-C films with the carbon atom deposition energy, (b) sp3 depth profiles of a-C films for carbon atom deposition energy equal to 1, 20, 80, and 120 eV (negative depth values correspond to the silicon substrate), (c) silicon substrate after relaxation, (d) carbon-silicon intermixing during the initial deposition phase resulting in the formation of an intermixing layer, (e) main deposition phase involving the growth of a bulk layer, and (f) formation of a surface layer during the end of the deposition process. Silicon and carbon atoms are shown in green and yellow colors, respectively.

