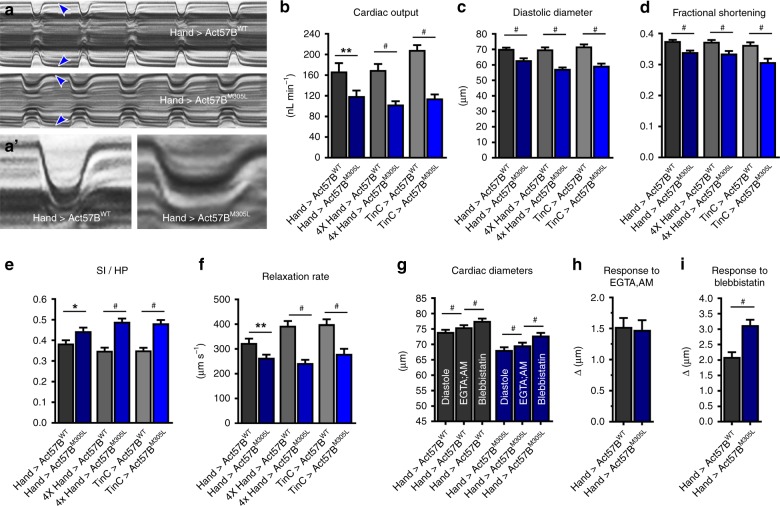
Fig. 2. M305L actin triggers restrictive cardiac physiology and impairs relaxation.
a M-mode kymograms generated from high-speed videos of beating, three-week-old Hand > Act57BWT and Hand > Act57BM305L hearts. These traces illustrate cardiac cycle dynamics and heart wall motion over time. Blue arrowheads demarcate the edges of the heart wall during diastole. Note the restricted diastolic diameter across the mutant cardiac tube. a′ Individual systolic intervals taken from the traces shown in (a). Relative to Hand > Act57BWT, Act57BM305L-expressing cardiac tubes exhibited prolonged periods of tension generation, diminished shortening, and slower relaxation rates. b–f Heart-restricted expression of Act57BM305L mutant actin significantly altered several indices of cardiac function, irrespective of genetic background, relative to the expression of Act57BWT. Hand > , 4XHand > , and TinC > Act57BM305L Drosophila displayed decreased cardiac output, diastolic diameters, fractional shortening, and relaxation rates in addition to extended systolic periods relative to controls. SI/HP is the systolic interval over the time required for a complete cardiac cycle (i.e. diastolic plus systolic intervals). Significant differences between genotypes were determined using unpaired two-tailed t-tests (n = 31–45). *P ≤ 0.05, **P ≤ 0.01 and #P ≤ 0.0001. g Significant, incremental increases in cardiac diameters were observed in Hand > Act57BWT and Hand > Act57BM305L Drosophila following extra- and intracellular Ca2+ chelation and, again, upon blebbistatin exposure. Increases in cardiac dimensions due to EGTA-EGTA,AM and to blebbistatin were evaluated using repeated measures ANOVAs followed by Tukey’s multiple comparison tests of the matched groups (n = 30–31). #P ≤ 0.0001. h The change in cardiac diameter in response to EGTA-EGTA,AM was similar between Hand > Act57BWT and Hand > Act57BM305L flies as determined by two-tailed unpaired t-tests (n = 30–31). i Blebbistatin treatment resulted in a significantly greater degree of heart wall relaxation in Hand > Act57BM305L hearts relative to Hand > Act57BWT hearts. Two-tailed unpaired t-tests were used to distinguish significant differences in cardiac diameter changes between genotypes (n = 30-31). #P ≤ 0.0001. All data are presented as mean ± SEM. Source data are provided as a Source Data file.

