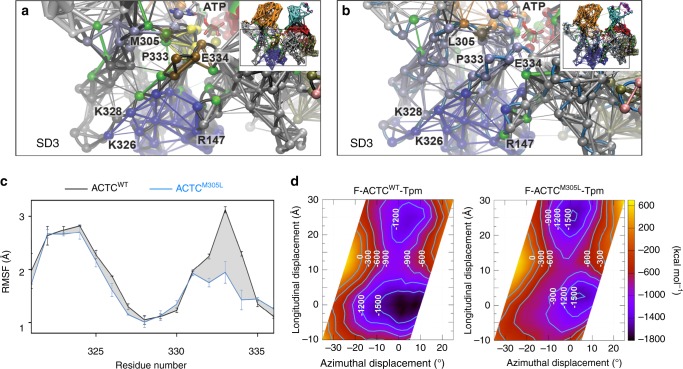
Fig. 6. ACTCM305L exhibits altered communication pathways and coupled motions and distorts F-actin–Tpm electrostatic energy landscapes.
a Dynamical network analysis of cMD simulations of an ACTCWT Tpm-interacting subregion revealed a high degree of coupled motions, represented by the thickness of the connections and weighted according to the correlation data obtained from PCA. Clustered network communities were identified using the Girvan–Newman algorithm and colored individually, indicating regions of concerted movements. Critical residues and connections between two network communities are presented in green. P333 and E334 formed a separate community (brown) that maintained some flexibility and moved independently with respect to K326 and K328. Inset: dynamical network analysis of an entire ACTCWT protomer (see Supplementary Fig. 10A) demarcating the enlarged region discussed above. b Dynamical network analysis of cMD simulations of ACTCM305L showed that the coupled motions of the Tpm-interacting subregion around P333 and E334 differed from those of ACTCWT and moved in concert with K326 and K328 and the community surrounding L305 (light blue). Inset: dynamical network analysis of an ACTCM305L protomer (see Supplementary Fig. 10B) demarcating the enlarged region discussed above. c Root mean square fluctuations (RMSF) of Cα atoms along a stretch of actin residues that forms stable interactions with and facilitates inhibitory positioning of Tpm, measured over the course of enhanced sampling MD simulations. Data are represented as mean ± SEM (n = 2). d Average electrostatic energy landscapes for wildtype (left) and M305L F-actin–Tpm (right). The origin is set at 0,0, which represents the previously determined energy minimum of the inhibitory, A/B configuration for wildtype F-actin–Tpm24, where Tpm is located in a position that would impede myosin binding. The plot is contoured with isolines between −1500 and 0 kcal mol−1 in increments of 300 kcal mol−1. Note, the broad well around the origin in the wildtype plot is shallower and narrower in the mutant F-actin–Tpm plot. Additionally, a second equivalent energy well is located distal to the A/B site along the mutant filament, which might be predicted to bias Tpm to a non-inhibitory location. Source data are provided as a Source Data file.

