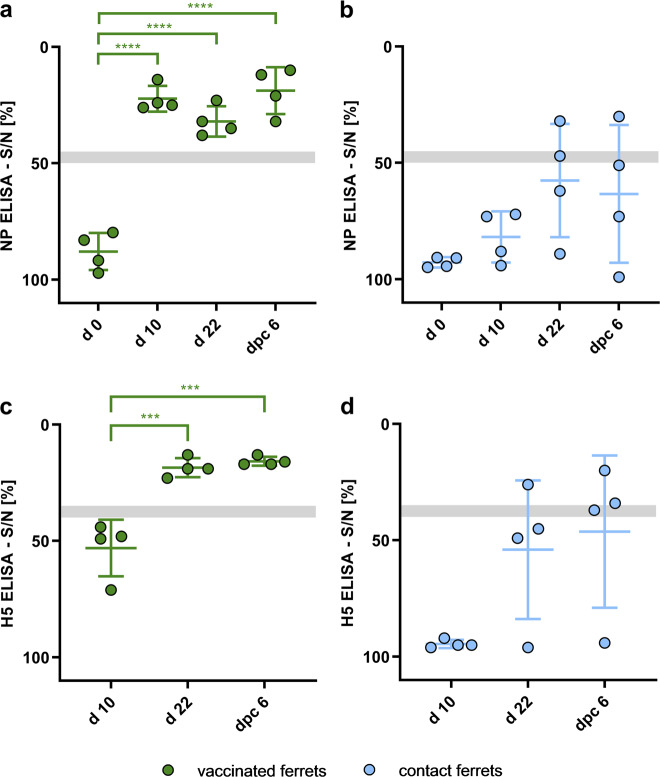
Fig. 6. Humoral immune response to R65mono/H17N10 immunization and subsequent challenge infection in ferrets.
Serum samples were taken from all animals on d0, d10, d22, and 6 days post challenge (dpc6 = d28), and evaluated by a competitive Enzyme-linked Immunosorbent Assay (ELISA) specific for nucleoprotein (NP) (a, b) or hemagglutinin H5 binding antibodies (c, d). Reduction of the measured signal-to-noise (S/N) % value of a sample indicates presence of specific Ab. Gray bar indicates reactive response, whereas lower values specify seropositivity. Asterisks indicate the statistical differences between different time points on group level, calculated using one-way ANOVA, and followed by post-hoc Tukey´s test. *p ≤ 0.05, **p ≤ 0.01, ***p ≤ 0.001, ****p ≤ 0.0001. Error bars indicate standard error of the mean (SEM).

