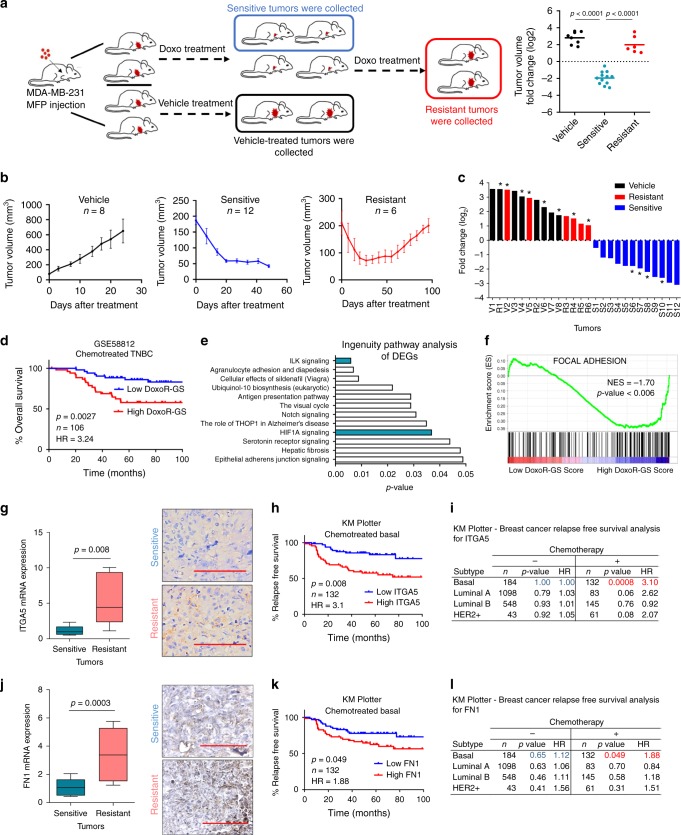
Fig. 1. Integrin signaling is a key mediator of chemoresistance in TNBCs.
a Schematic representation of developing doxorubicin resistance in mice using the TNBC cell line, MDA-MB-231 (left panel). Tumor volume fold change (log2) of vehicle-treated, doxorubicin-sensitive and -resistant tumors (right panel). Clipart reprinted with permission from Springer Nature, Nature Protocols, FACS isolation of endothelial cells and pericytes from mouse brain microregions, Elizabeth E Crouch and Fiona Doetsch, Copyright 2018. b Tumor volumes of vehicle (n = 8), sensitive (n = 12) and -resistant (n = 6) tumors. c Waterfall plot of tumor volume fold change over time. Asterisk indicates tumors profiled by RNA-Seq. V vehicle; S sensitive; and R resistant. d Kaplan–Meier survival curve representing the percentage overall survival (OS) in chemotherapy-treated TNBC patients (n = 106) based on low vs. high (median) DoxoR-GS score. e Summary of IPA analysis showing top deregulated pathways in doxorubicin-resistant xenografts. f Genes associated with focal adhesion signaling are enriched in tumors of high DoxoR-GS scorers from GSE58812. g Expression of integrin alpha 5 (ITGA5) in doxorubicin-sensitive (n = 8) vs. -resistant (n = 6) xenografts at mRNA (left) and protein (right) levels, demonstrating membranous and cytoplasmic staining. h Kaplan–Meier survival curve representing the percentage relapse-free survival (RFS) in chemotherapy-treated basal patients (n = 132) based on low vs. high ITGA5 (median) expression. i Table summarizing association of ITGA5 with survival in patients of different subtypes that received or did not receive chemotherapy. j Expression of fibronectin (FN1) in doxorubicin-sensitive (n = 12) vs. resistant (n = 12) tumors at mRNA (left) and protein (right) levels, demonstrating mild to moderate cytoplasmic staining. k Kaplan–Meier survival curve representing the percentage RFS in chemotherapy-treated basal breast cancer patients (n = 132) based on low vs. high FN1 (median) expression. l Table summarizing association of FN1 with survival in patients of different subtypes that received or did not receive chemotherapy. Data on b represent mean ± SEM and all others represent mean ± SD. In Box plots, the box depicts median, 25th to 75th percentiles, and the whisker depicts min to max for this figure and all others. Two-sided Student’s t-test was used to calculate statistical difference between two groups. Significance for survival analyses was calculated by log-rank (Mantel-Cox) test. NES Normalized enrichment score, HR hazard ratio. Scale bar = 100 µm for g, j. Source data are provided as a Source data file.

