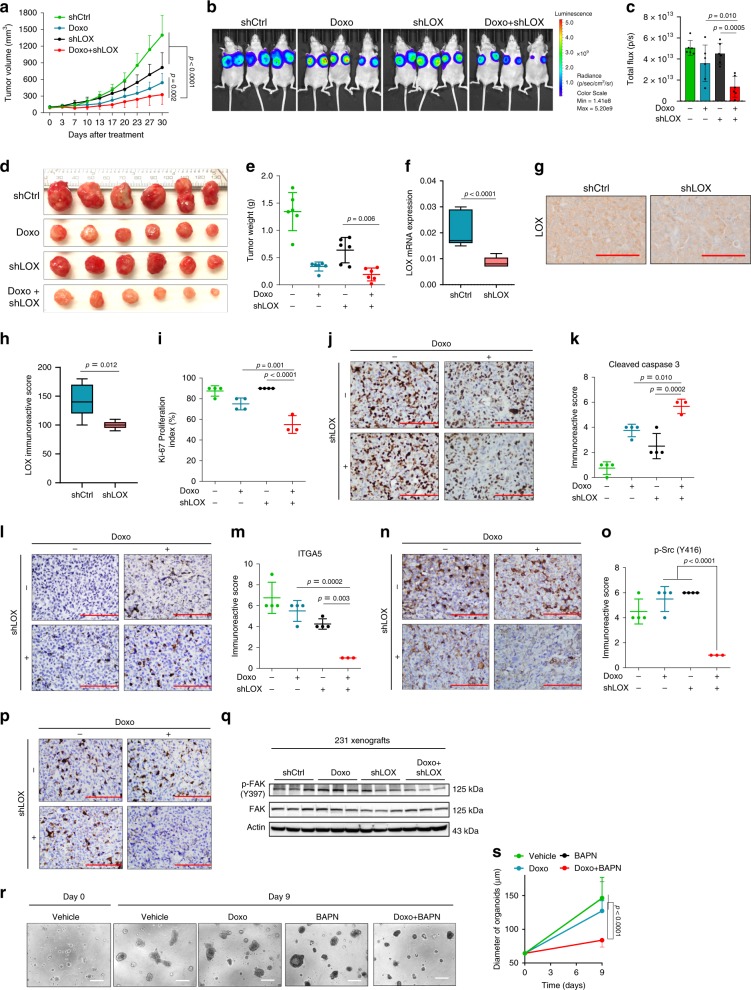
Fig. 6. Targeting LOX at the first-line settings potentiates chemoresponse in TNBCs.
a Tumor volume in MDA-MB-231 xenografts upon shLOX induction in the presence or absence of doxorubicin treatment (n = 6). b IVIS images of mice from a. c Quantifications of luciferase intensity in tumors from b (n = 6). d Images showing isolated tumors from a. e Tumor weights in mice from a (n = 6). f qRT-PCR analysis of LOX in Ctrl (n = 9) vs. shLOX (n = 9) xenografts. g, h IHC staining of LOX and its quantification in Ctrl (n = 5) vs. shLOX (n = 5) tumors. i, j Ki-67 proliferation index of tumors from a (n = 4 (vehicle, Doxo, BAPN), n = 3 (Doxo+BAPN)). k–p Immunoreactive scores of Cleaved Caspase-3 (k, l), ITGA5 (m, n) and p-Src (Y416) (o, p) in tumors from a (n = 4 (vehicle, Doxo, BAPN), n = 3 (Doxo + BAPN)). q Western blot analysis of p-FAK and FAK in shLOX tumors in combination with doxorubicin. r Representative images of TNBC patient organoid, F149T at day 0 and day 9 after treatment with doxorubicin and BAPN, alone or in combination. s Quantification of organoid diameter upon combination therapy for 9 days (n = 12 (Day 0), n = 9 (vehicle, Day 9), n = 11 (Doxo, BAPN, Doxo+BAPN, Day 9)). Data represents mean ± SD. Two-sided Student’s t-test was used to calculate statistical difference between two groups. One-way ANOVA with Dunnett’s test was performed to compare mean of combination-treated group with single agent treatments in c, e, i, k, m, o, and s. Two-way ANOVA test was performed for comparing tumor growth over time among different treatment groups in a. Scale bar = 100 µm for g, j, l, n, p, r. Source data are provided as a Source data file.

