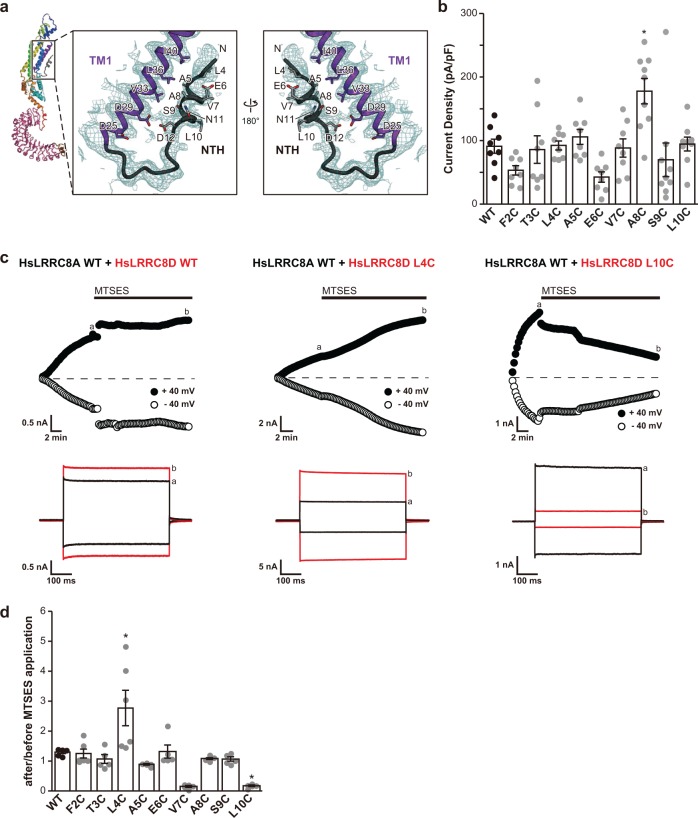
Fig. 4. Role of the NTH in substrate permeation.
a Close-up view of the NTH and TM1 helix of HsLRRC8D. The EM density map around the NTH and TM1 helix is shown in dark cyan. The side chains of the NTH and TM1 helix are depicted in stick representations. b Comparisons of the cell swelling-induced whole-cell currents recorded at +40 mV in LRRC8−/− cells co-transfected with HsLRRC8A wild type and HsLRRC8D wild type, or with HsLRRC8A wild type and each of nine HsLRRC8D cysteine-substituted mutants (n = 8–9). c Representative time courses recorded from the start of the whole-cell configuration with hypertonic pipette solution (upper panels) and expanded traces of current responses recorded at the time points a and b (lower panels) in the LRRC8−/− cells co-transfected with HsLRRC8A wild type and HsLRRC8D wild type, HsLRRC8A wild type and HsLRRC8D L4C mutant, or HsLRRC8A wild type and HsLRRC8D L10C, during applications (every 15 s) of alternating step pulses of ±40 mV. Black bars indicate an application of 1 mmol L−1 MTSES. d Swelling-induced currents at +40 mV in the cells expressing HsLRRC8A wild type and HsLRRC8D wild type, or HsLRRC8A wild type and each of nine HsLRRC8D cysteine-substituted mutants after MTSES application, normalized to those before MTSES application. Each column represents the mean ± SEM (n = 5–6). *P < 0.05 compared to wild type. P values are the results of one-way ANOVA analysis of variance, Tukey–Kramer test.

