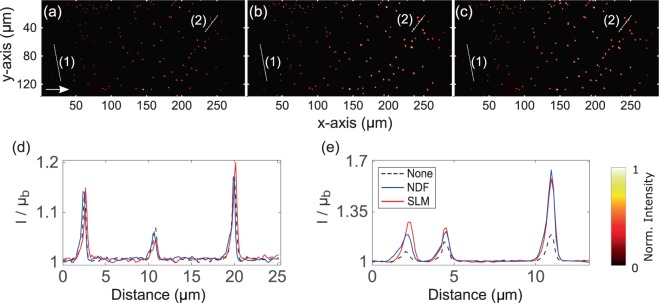
Figure 2.
Maximum intensity projections of the recorded two-photon Airy LSFM images (a–c) of 400 nm diameter fluorescent microspheres in attenuating 2 mM concentrated NIR dye solution. (a) No attenuation-compensation, (b) attenuation-compensation using NDF, and (c) attenuation-compensation using SLM (). (d) Intensity profiles along the dashed line (1) shown in (a–c). (e) Intensity profiles along the dashed line (2) shown in (a–c) at a depth of ~ into the sample. The arrow in (a) denotes the direction of propagation of the Airy light-sheet. Look-up tables of the images shown in (a–c) are independently scaled to the data shown. Line intensity profiles in (d,e) are normalized with respect to the local mean background .

