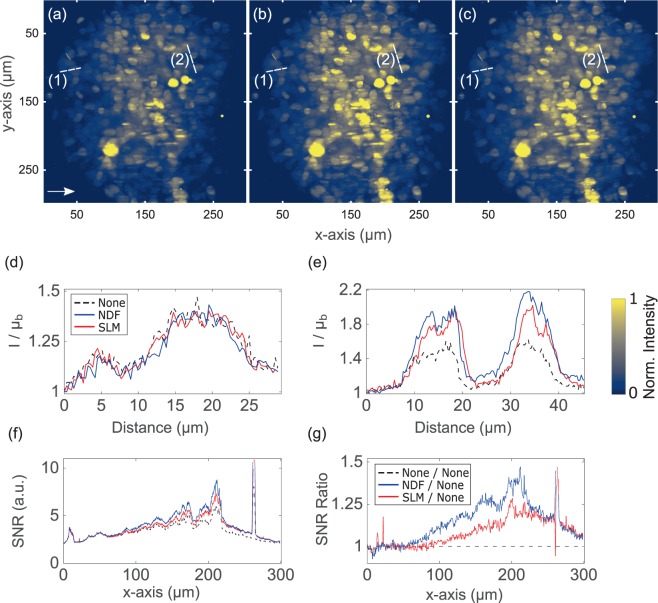
Figure 3.
Maximum intensity projections of recorded two-photon Airy LSFM images (a–c) of μm diameter HEK-293 spheroid stably expressing GFP. (a) No attenuation-compensation, (b) attenuation-compensation using NDF, and (c) attenuation-compensation using SLM (). (d,e) Intensity profiles along dashed lines (1) and (2) respectively, shown in (a–c). (f) SNR plotted as a function of propagation coordinate, , for no-attenuation compensation, attenuation-compensation using NDF, and attenuation-compensation using SLM (). (g) Ratios of SNR with NDF-based compensation (blue) and SLM-based compensation (red) to no compensation. The arrow in (a) denotes the direction of propagation of the Airy light-sheet. Look-up tables of the images shown in (a–c) are independently scaled to the data shown. Line intensity profiles in (d–e) are normalized with respect to the local mean background . This dataset can be accessed at this website21.

