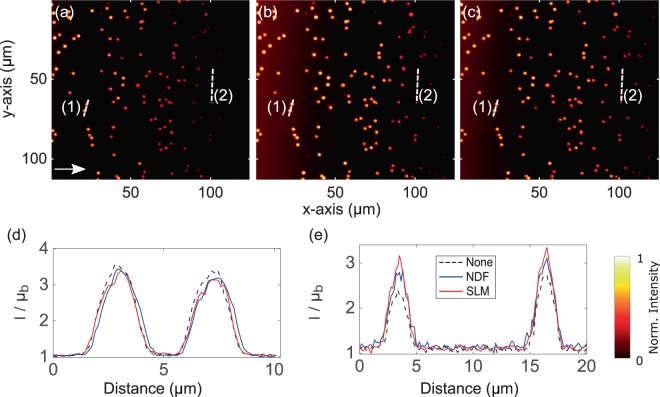
Figure 5.
Maximum intensity projections of the deconvolved single-photon Airy LSFM images (a–c) of μm diameter fluorescent microspheres in attenuating 0.88 mM concentrated fluorescein solution. (a) No attenuation-compensation, (b) attenuation-compensation using the NDF, and (c) attenuation-compensation using the SLM (). (d) Intensity profiles along the dashed line (1) near the start of the FOV where intensities of all three cases match shown in (a–c). (e) Intensity profiles along the dashed line (2), ~ μm deeper into the sample, shown in (a–c). The arrow in (a) denotes the direction of propagation of the Airy light-sheet. Look-up tables of the images shown in (a–c) are independently scaled to the data shown. Line intensity profiles in (d,e) are normalized with respect to the local mean background .

