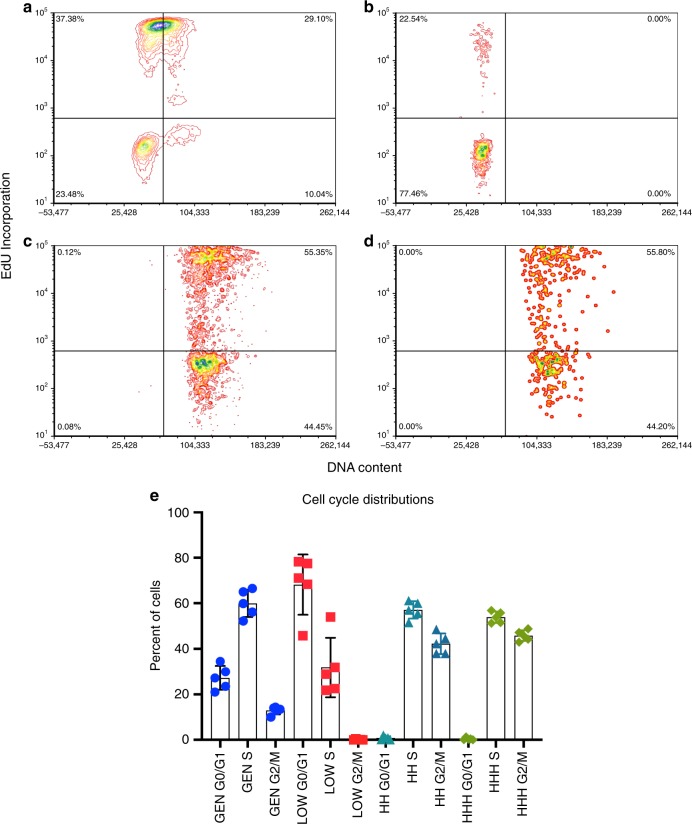
Fig. 3. Cell cycle analysis of hPSC subpopulations by flow cytometry of EdU labeled cultures.
Cells were pulsed labeled with EdU, sorted into three subpopulations using cell surface markers GCTM-2 and CD9 with or without EPCAM, and analyzed by flow cytometry. a–d Flow cytometry profiles from one experiment. a Unsorted population; b GCTM-2lowCD9low; c GCTM-2highCD9high; d GCTM-2highCD9highEPCAMhigh; e summary showing results from seven experiments. Mean values are shown and error bars represent standard error of seven biological replicates; General is unsorted population, low is GCTM-2lowCD9low, HH is GCTM-2highCD9high, and HHH is GCTM-2highCD9highEPCAMhigh. See Supplementary Table 6 for biological replicate data points.

