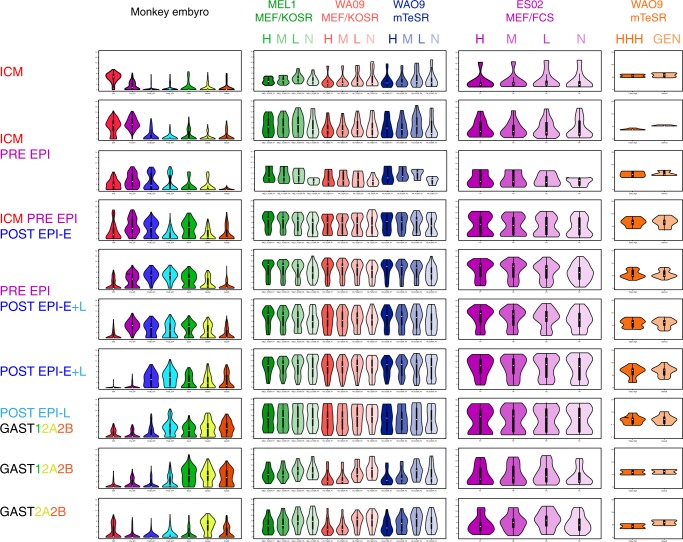
Fig. 9. String section plot comparison of expression of embryonic stage-specific genes by scRNA-seq in cynomolgus embryo30 with expression in subpopulations of hPSC.
The violin plots in the left hand column show expression from single-cell RNA-seq data in ref. 30, with classification of cells as described therein; embryonic stages in which particular gene sets (Supplementary Table 4, each row in the figure displays violin plots for one gene set) are expressed are listed to the left of the plots. The second column shows microarray data from ref. 27 for the same sets of genes in GCTM-2highCD9high (H), GCTM-2midCD9mid (M), GCTM-2lowCD9low (L), and GCTM-2negCD9neg (N) subpopulations of MEL1 cells grown in the presence of medium containing Knockout Serum Replacer on mouse embryo fibroblast feeder cell layers (MEF/KSOR), or WA09 cells grown in MEF/KSOR or mTeSR defined medium. The third column shows microarray data from ref. 16 for the same sets of genes on GCTM-2highCD9high (H), GCTM-2midCD9mid (M), GCTM-2lowCD9low (L), and GCTM-2negCD9neg (N) subpopulations of ES02 cells grown in serum-containing medium on mouse embryo fibroblast feeder cell layers (MEF/FCS). The last column shows RNA-seq bulk data on the same sets of genes from the current study for GCTM-2highCD9highEPCAMhigh (HHH) and unsorted (GEN) cells. Colors of violins correspond to embryonic stages or cell subpopulations identified in labels at left or top of figure (last three columns), respectively.

