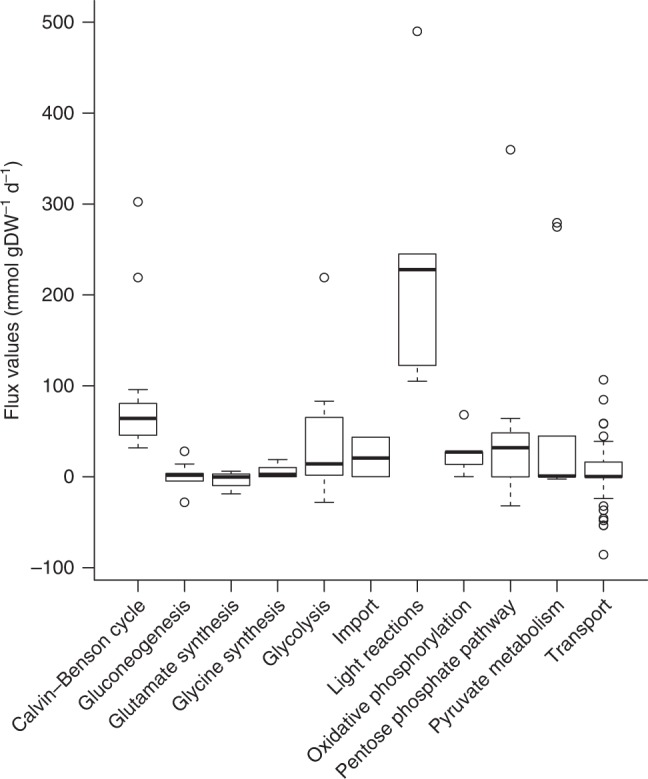
Fig. 2. Flux ranges of metabolic systems in the metabolic model of A. thaliana.

The metabolic systems with the most variable fluxes are shown in the x-axis. Largest variation is exhibited for glycolysis, photosynthesis light reactions, and pentose phosphate pathway. The remaining metabolic systems exhibit small fluxes, small variations, or both (Supplementary Fig. 3). n=3 to 76 fluxes in each metabolic system are used. Center line, median; box limits, 75th and 25th quartiles; whiskers, 1.5×interquartile range; points, outliers. Source data are provided as a Source Data file.
