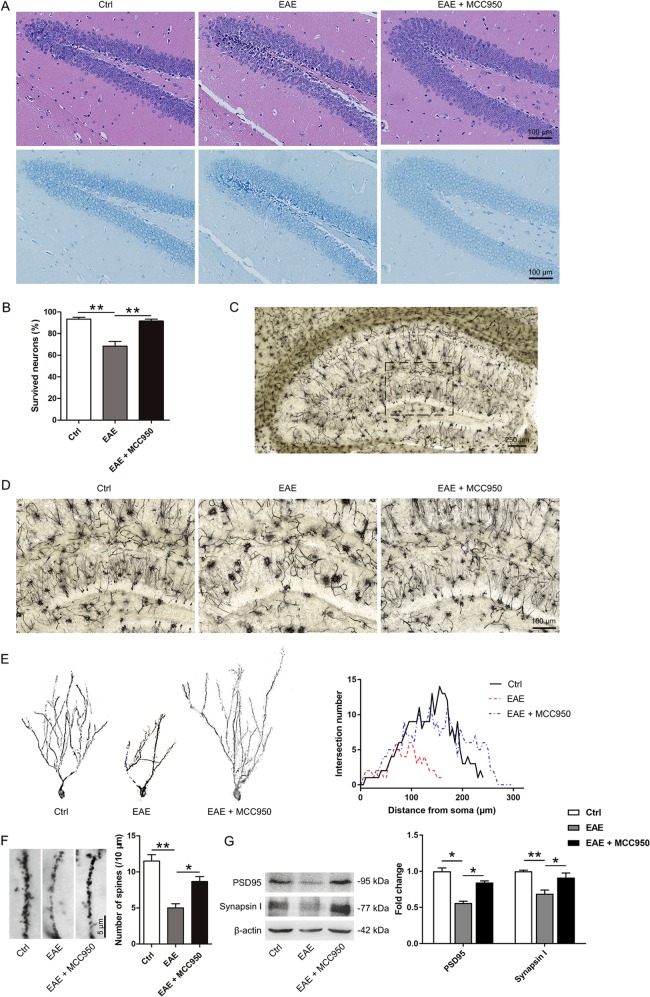
Fig. 3. NLRP3 inflammasome activation contributes to hippocampal pathology in EAE mice.
a Representative Nissl and H&E staining of the hippocampal DG region. b The quantitative analysis of intact hippocampal DG neurons. c Representative Golgi staining of the hippocampal DG region. d Representative magnified images of Golgi staining in the DG region of the three groups. e A graphical drawing showing neuron. At least 10 neurons from 6 mice per group were analyzed by Sholl analysis. f Representative images and the quantification of the spine number in the different groups. g Western blots and densitometric analysis for synapsin І and PSD95. β-actin was used as an internal control. The data are the mean ± SEM, n = 6 biologically independent animals, *P < 0.05, **P < 0.01.

