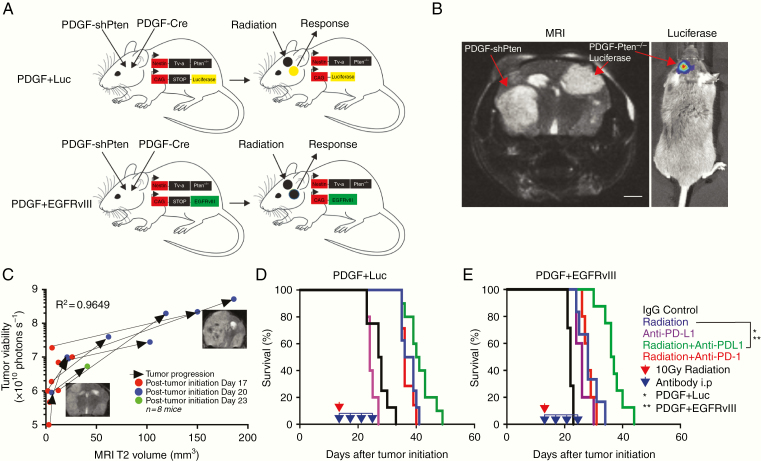
Fig. 1.
Combined unilateral radiation and systemic anti–PD-L1 immunotherapy increase survival in a bilateral glioblastoma model. (A) Strategy for inducing mouse bilateral glioblastoma within the brain using the RCAS/TVA mouse model for immune microenvironment profiling and Cre-recombination strategy used to generate unilateral luciferase expressing PDGF + Luc (top) and PDGF + EGFRvIII (bottom) tumors (Tg(NES-TVA);Cdkn2a (Ink4a-Arf)-/-;Ptenfl/fl; LSL Luciferase and EGFRvIII mice). (B) Representative MRI (left panel) of a bilateral glioblastoma mouse model. Right panel is bioluminescence signal from mouse in left panel, showing unilateral luciferase activity from the left-sided PDGF-Pten-/- tumor only. Red arrows delineate tumors on each side of brain. Scale bar = 1 mm. (C) Correlation between tumor viability (luciferase activity) and MRI T2-weighted signal in IgG-treated animals bearing bilateral glioblastoma (n = 8 mice, R2= 0.9649). Two to 3 representative MRI scans highlighting interval growth in one untreated animal with arrows showing direction of growth between scans. Red circles are measurements from time point 1 (post-tumor initiation day 17), blue circles are measurements from time point 2 (post-tumor initiation day 20), and green circles are measurements from time point 3 (post-tumor initiation day 23). Y-axis in logarithmic scale (photons second−1). X-axis in linear scale (mm3). (D–E) Kaplan–Meier survival curves showing that anti–PD-L1 immunotherapy enhances unilateral radiation-induced survival in bilateral PDGF + Luc (D) and PDGF + EGFRvIII (E) glioblastoma (n = 6–8 mice per treatment group). Red arrow indicates unilateral 10 Gy irradiation. Blue arrow indicates daily anti–PD-L1 or anti-PD1 treatments. Treatments began on post-tumor initiation day 15. Log-rank Mantel–Cox test for radiation alone versus radiation with anti–PD-L1. *P < 0.05 for PDGF + Luc, **P < 0.01 for PDGF + EGFRvIII.

