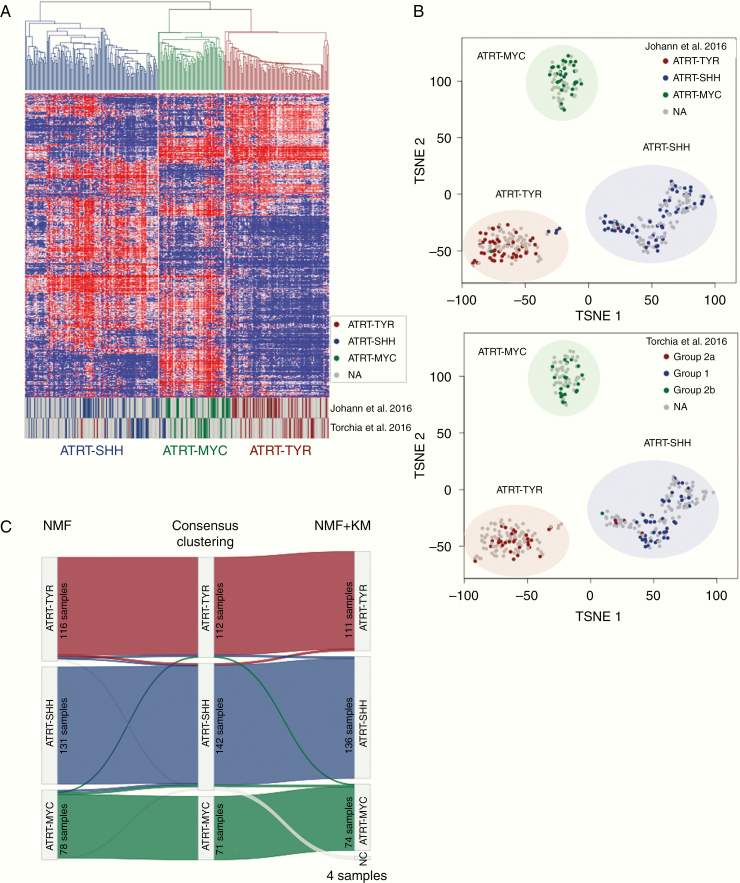
Fig. 2.
Methylation array analysis of the consensus dataset. (A) Unsupervised hierarchical clustering using the top 5000 most variable cytosine-guanine (CG) sites confirms the presence of 3 subgroups in the consensus dataset (325 samples). (B) t-SNE visualization of the analyzed dataset based on the 5000 most variable CG sites reproduces segregation into 3 main ATRT subgroups. Coloring of data points in the t-SNE plots displays the subgrouping as published by Johann et al8 (upper plot) or by Torchia et al7 (lower plot). Half transparent circles show the consensus subgroups used in this paper. (C) Sankey plot displaying the concordance between the subgroup calls using different methods (NMF, consensus clustering, and NMF + k-means based subgrouping). Numbers in each subgroup show the number of samples which have been assigned to the subgroup with the respective method.

