Fig. 3.
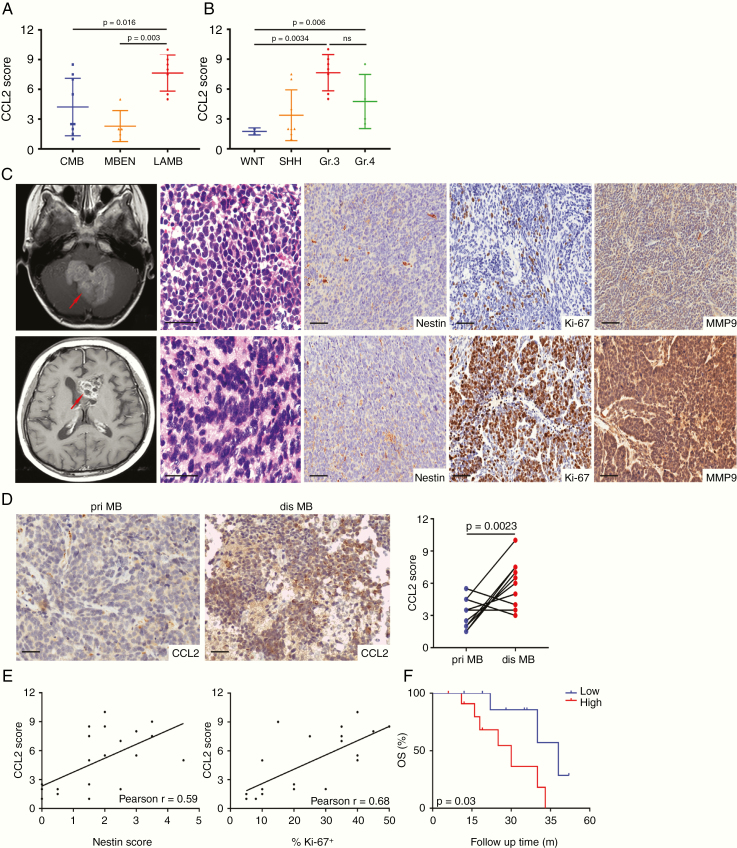
CCL2 correlated with poor prognosis of patients with recurrent MB. (A) CCL2 expression in classic MB, MB with extensive nodularity, and large-cell/anaplastic MB. (B) CCL2 expression in molecular subgroups of recurrent MB. (C) Representative enhanced T1-weighted images for one pair of matched primary and disseminated Group 3 MB7965 (red arrow), with H&E staining and IHC staining for Nestin, Ki-67, and MMP9. (D) Representative images of CCL2 expression in one pair of matched MB and the statistical graph showing CCL2 scores in 10 pairs. (E) The association of CCL2 with Nestin or Ki-67 estimated by Pearson analysis. (F) The overall survival Kaplan–Meier curve of recurrent MB patients. Scale bars, 10 μm.

