Figure 1.
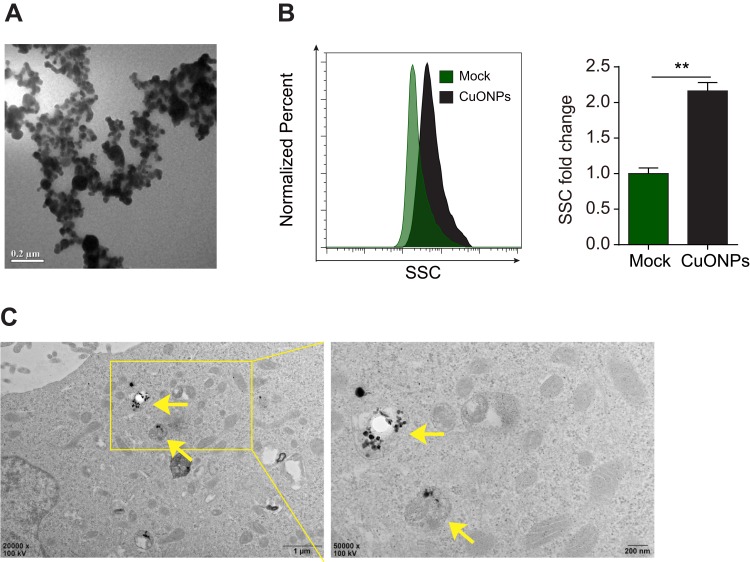
Physical properties and cellular uptake of CuONPs. (A) A representative transmission electron microscope (TEM) image of CuONPs dissolved in distilled water. (B) Representative FACS data for SSC intensity of HUVECs treated with 20 μg/mL CuONPs for 12 h. Mock, untreated HUVECs. Unpaired Student’s t-tests were performed for statistical analysis. **p < 0.05 versus untreated HUVECs. (C) Representative TEM images of HUVECs treated with 20 μg/mL CuONPs for 12 h. Yellow arrows indicate lysosomal deposition of CuONPs.

