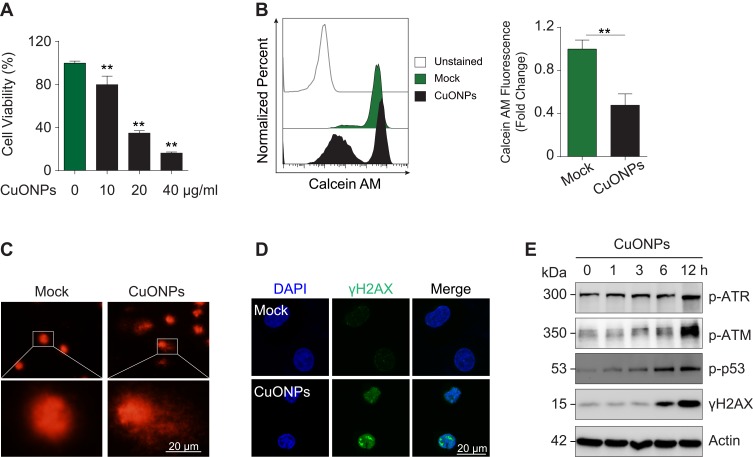
Figure 2.
DNA damage and cell death in CuONPs-treated HUVECs. (A) MTS assay of HUVECs treated with different concentrations of CuONPs (0, 10, 20, or 40 μg/mL) for 24 h. (B) Representative FACS data for CuONPs-treated HUVECs after Calcein AM (live cell fluorescent probe) staining. (C) Comet assay to evaluate CuONPs-induced DNA damage in HUVECs. (D) Immunofluorescence assay of γH2AX foci formation in CuONPs-treated HUVECs. (E) Western blotting assay of phospho-ATR, phospho-ATM, phospho-p53 and phospho-H2AX (γH2AX) in HUVECs treated with CuONPs (20 μg/mL) for 0, 1, 3, 6 and 12 h. Actin was used as a loading control. In (A), one-way ANOVA followed by Tukey’s test was performed for statistical analysis. In (B), unpaired Student’s t-tests were performed for statistical analysis. **p < 0.05 versus untreated HUVECs.

