
Fig. 4.
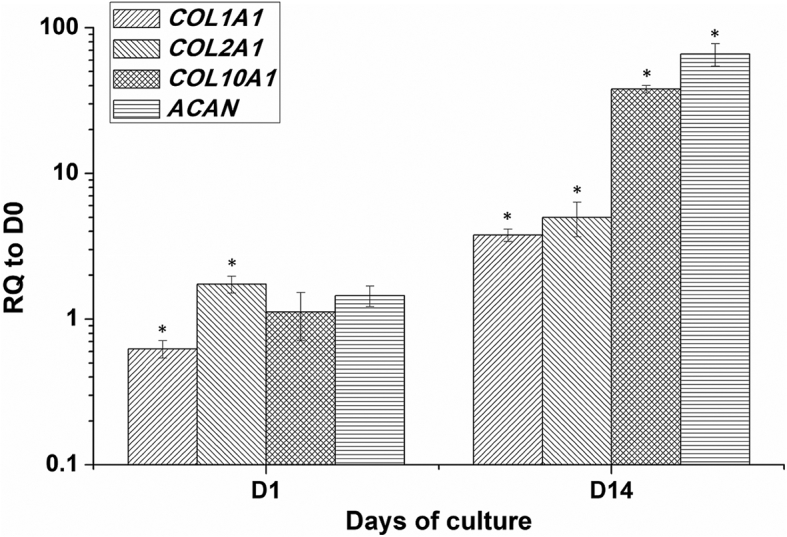
Gene expression of COL1A1, COL2A1, COL10A1, and ACAN in human ASCs cultured in the chitosan-cartilage ECM composite scaffolds. Data presented as the relative quantification (RQ) to day 0 transcript values (mean ± SD). ∗p < 0.05 relative to the day 0 sample for each gene.