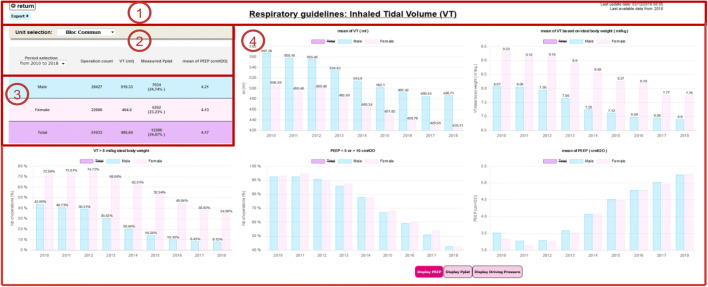
Fig. 2.
The ventilation management dashboard. Section 1 features the dashboard’s name, information about data availability, and print button. Section 2 offers settings for selecting the medical unit and the time period displayed. Section 3 is a summary table. Section 4 is the main part of the dashboard, with all the charts

