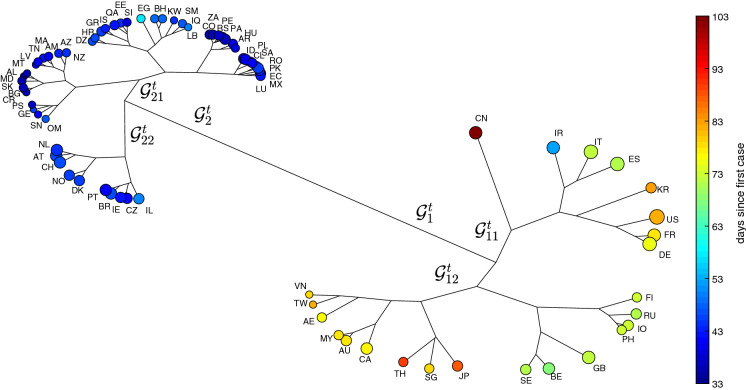
Fig. 4.
The HC tree for the 79 countries using the item-to-item dissimilarities in the time-domain during the period time . The size of the ‘leafs’ is proportional to the logarithm of the total number of infections and the color is proportional to the time elapsed since the first reported case in each country up to T

