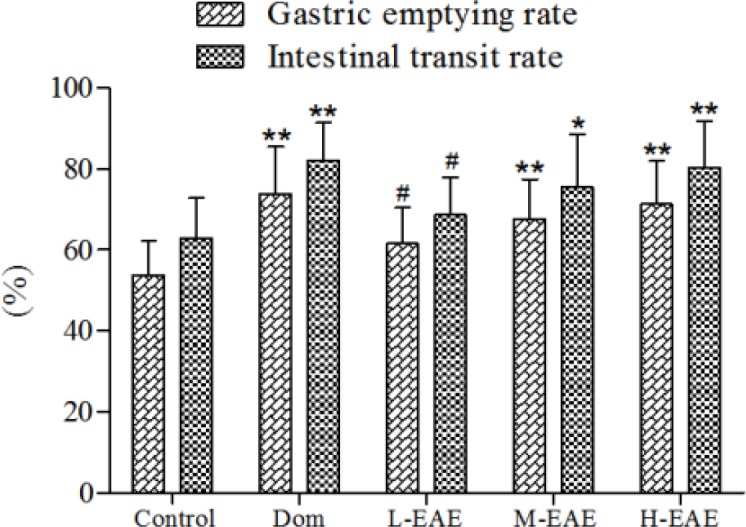
Figure 3.
Effects of different doses of EAE on gastric emptying and small intestinal motility in rats. Data are represented as the mean±SD. **Compared with control, P-value<0.01; *compared with control, P-value<0.05. ##Compared with Dom, P-value<0.01; #compared with Dom, P-value<0.05

EAE: ethyl acetate extract
