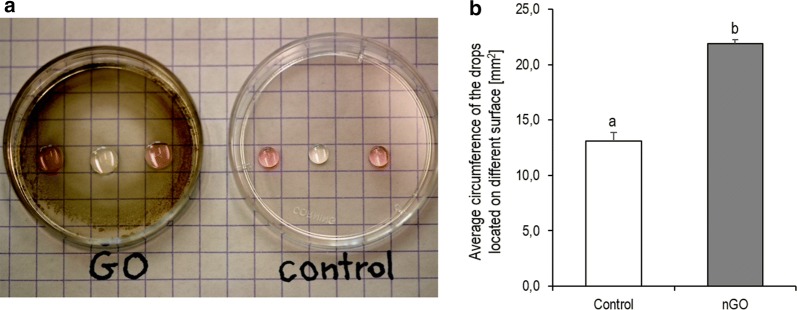
Fig. 2.
a The digital visualisation of the hydrophilicity properties of graphene oxide nanofilm (nGO) surface in relation to the plastic plate surface. b The comparison of the average circumference of the drops (water and Dulbecco’s modified Eagle medium; DMEM) located on the clear surface of the culture plastic dish (control) and on the surface coated with nGO. The error bars represent standard error of mean (n = 6 per group). Different letters (a–b) above the columns indicate statistically significant differences (p ≤ 0.05) analysed by t-test. Measurements were performed using ImageJ software

