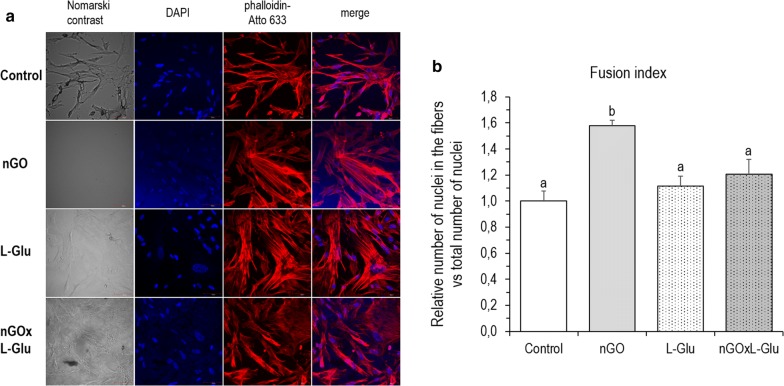
Fig. 5.
Differentiation status of the chicken embryo muscle control cells and treated with graphene oxide nanofilm (nGO), l-glutamine (L-Glu), and on nGO with L-Glu supplementation (nGOxL-Glu). a Confocal microscopy visualisation images (×40 magnification): grey = Nomarski interference contrast, blue = 4′,6-diamidino-2-phenylindole (DAPI) nuclei staining, red = actin filaments with phalloidin-Atto 633 staining; b quantitative analysis of the fusion index of the differentiating cells. The error bars represent standard error of mean (n = 8 per group). Different letters (a–b) above the columns indicate statistically significant differences (p ≤ 0.05) analysed by Tukey’s HSD test

