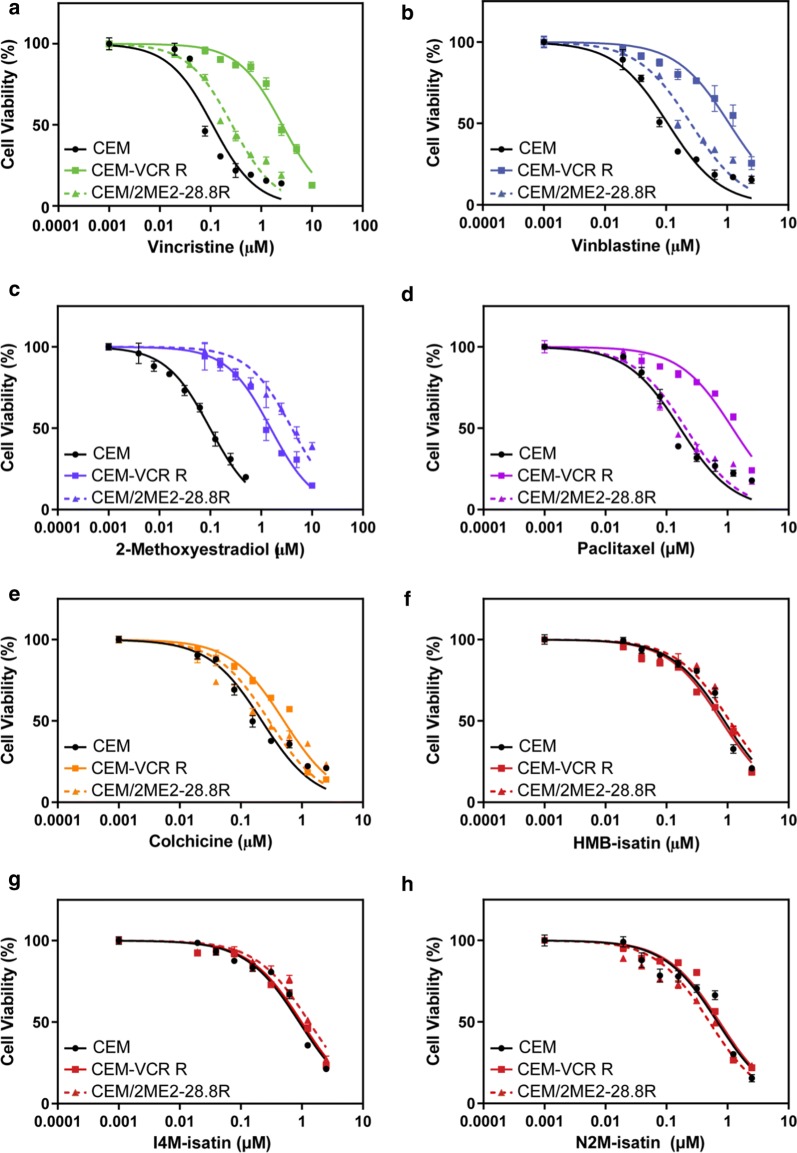
Fig. 2.
Dose-response curves for parental (CEM), vincristine-resistant (CEM-VCR R) and 2ME2-resistant (CEM/2ME2-28.8R) ALL cell lines treated with varying concentrations of commercial drugs (a–e) or N-alkylisatins (f–h). CEM (black), CEM-VCR R (solid) and CEM-2ME2/28.8R (dashed) cells were incubated with increasing concentrations of drug at 37 °C for 48 h. Cells were then assessed for metabolic activity by addition of MTS reagent and the OD measured at 490 nm. Dose–response curves were generated using GraphPad Prism v7.0. Values are the mean of triplicates (± SD)

